![]() Figure 3 of
Zhang, Mol Vis 2007;
13:330-336.
Figure 3 of
Zhang, Mol Vis 2007;
13:330-336.
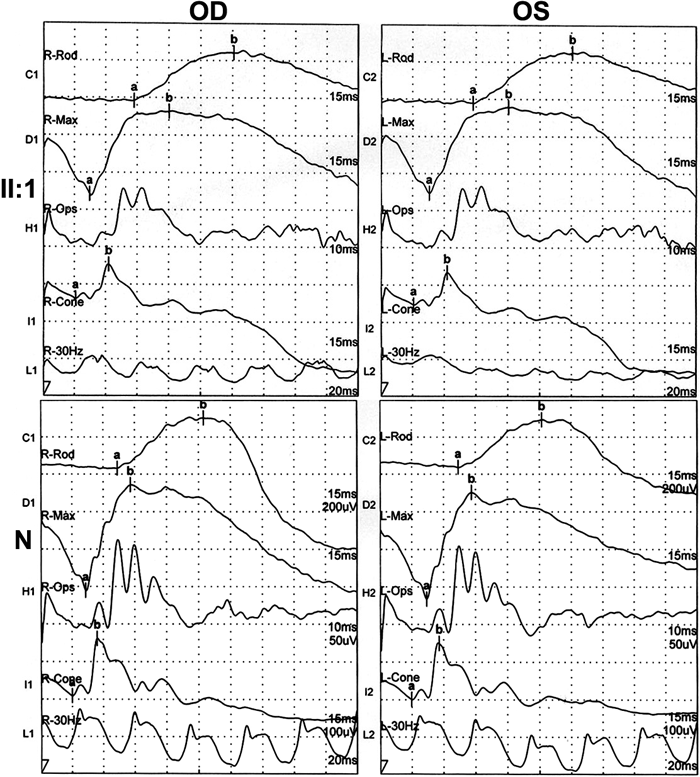
Figure 3. ERG recordings of individual II:1 in family B and that of a representative control (N)
Normal rod responses and mild reduced cone responses were shown. Scale for each subdivision: C1, C2: 200uV; D1, D2: 200uV; H1, H2: 50uV; I1, I2: 100uV; L1, L2: 100uV.
