![]() Figure 4 of
Liu, Mol Vis 2007;
13:309-317.
Figure 4 of
Liu, Mol Vis 2007;
13:309-317.
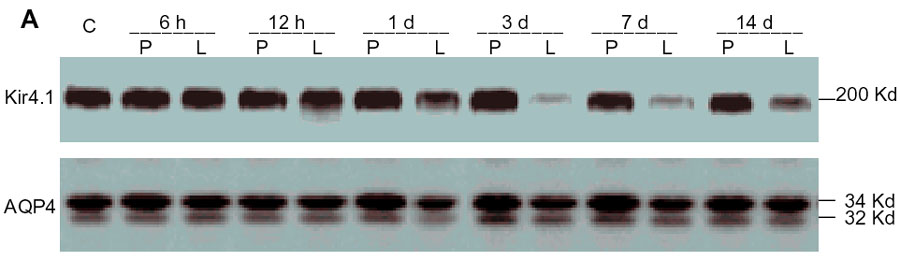
Figure 4. Time courses of Kir4.1 and aquaporin-4 protein expression in retinas from lipopolysaccharide- or phosphate-buffered saline-treated rats
A: Equal amounts of protein (30 μg) were subjected to immunoblotting analysis. A band at about 200 kDa represents Kir4.1 in its tetrameric form; aquaporin-4 (AQP4) consists of two bands, representing its M1 and M23 forms. B, C: The relative levels of Kir4.1 and AQP4 protein expression were quantified. Compared with that of the control, the expression of Kir4.1 was significantly reduced after LPS injection. In contrast, there was only a slight, statistically insignificant decline in AQP4 expression from 1 day to 7 day after LPS injection. (means±SEM, n=5; double asterisks (**) p<0.001 versus control). C indicates control; P indicates phosphate-buffered saline; L indicates lipopolysaccharide.