![]() Figure 3 of
Liu, Mol Vis 2007;
13:309-317.
Figure 3 of
Liu, Mol Vis 2007;
13:309-317.
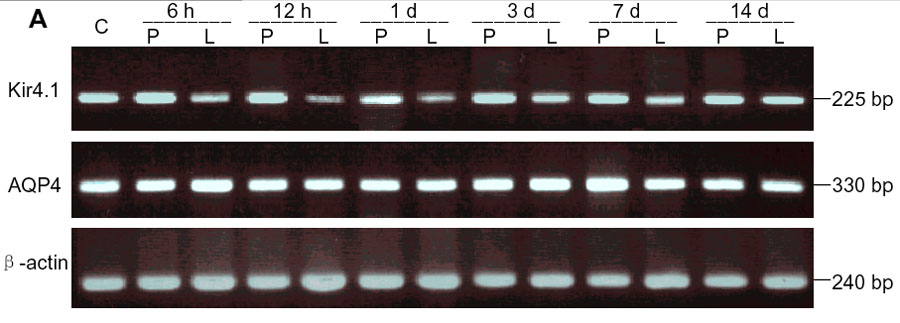
Figure 3. Time course of Kir4.1 and aquaporin-4 mRNA expression in lipopolysaccharide- or phosphate-buffered saline-treated rats
A: Total RNA (1 μg) was used for reverse transcriptase polymerase chain reaction (RT-PCR). A 330-bp product for aquaporin-4 (AQP4), a 225-bp product for Kir4.1, and a 240-bp product for β-actin were separated on a 2.0% agarose gel. B, C: The relative levels of Kir4.1 and AQP4 mRNA expression were quantified. Compared with the control, there was a significant decline in Kir4.1 in lipopolysaccharide (LPS)-treated animals, whereas there was no change in AQP4 after LPS injection (means±SEM, n=4; asterisk (*) indicates p<0.05, double asterisks (**) signifies p<0.001 versus control). C indicates control; P indicates phosphate-buffered saline; L represents lipopolysaccharide.