![]() Figure 6 of
Khalyfa, Mol Vis 2007;
13:293-308.
Figure 6 of
Khalyfa, Mol Vis 2007;
13:293-308.
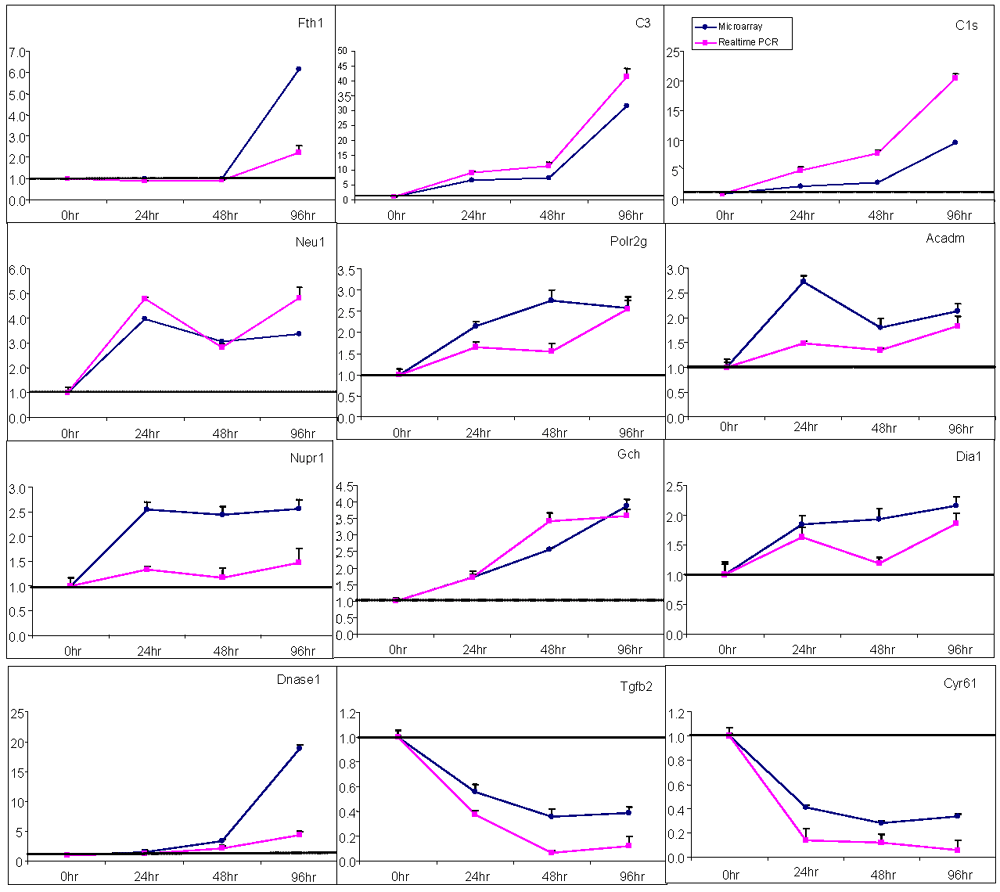
Figure 6. Comparative evaluation of microarray and real-time RT-PCR results
Twelve genes, identified as differentially expressed in gene arrays and regulated in response to time-dependent serum deprivation, were evaluated with RT-PCR. Values on the y-axis represent the fold change derived from the mean expression value for each gene, and values on the x-axis represent the time course of RGC-5 serum deprivation. Total RNA isolated from these cells was used for both microarray analysis and real-time RT-PCR. The closed circles (rectangle) represent microarray results, whereas the closed squares (circle) represent the quantitative RT-PCR data.
