![]() Figure 3 of
Khalyfa, Mol Vis 2007;
13:293-308.
Figure 3 of
Khalyfa, Mol Vis 2007;
13:293-308.
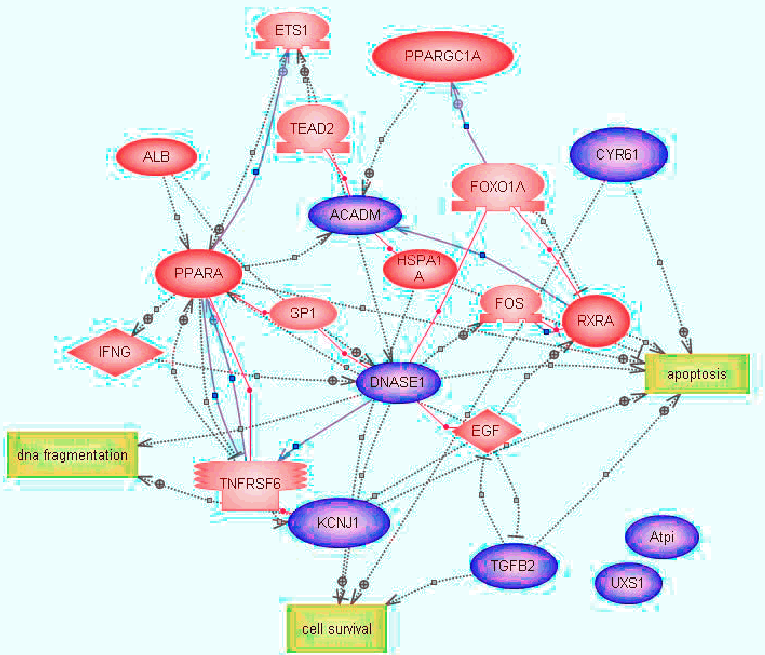
Figure 3. Schematic representations of potential signaling pathways involved in serum-deprived retinal ganglion cell-5 cells
Pathways were identified by incorporating the microarray results (differentially expressed genes identified at 8, 24, 48, and 96 h of serum deprivation) into PathwayAssist software. The pathway connects the proteins (blue color) and cell processes together. Three major biological processes of cell survival, apoptosis, and DNA fragmentation, regulated by these genes are represented by yellow color squares.
