![]() Figure 6 of
Reza, Mol Vis 2007;
13:18-30.
Figure 6 of
Reza, Mol Vis 2007;
13:18-30.
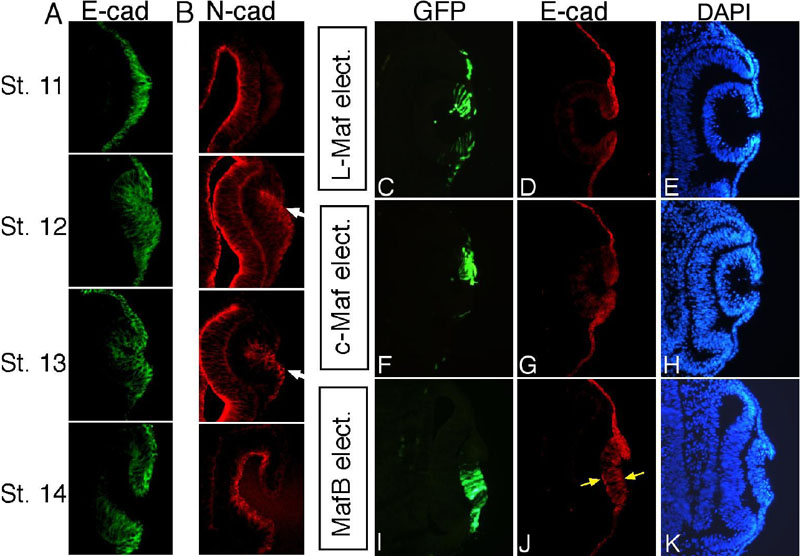
Figure 6. Effects of Maf expression on E-cadherin
Expression patterns for E- and N-cadherins by section immunostaining are shown at stage 11, 12, 13, and 14 (A,B, respectively). White arrows indicate the N-cadherin-positive cells (B). Immunohistochemical analyses with the cryosections from stage 16 embryos revealed ectopic expression of E-cadherin in the invaginating lens placode when MafB was electroporated (J, yellow arrows). No effect on E-cadherin is observed in the sections electroporated with L-Maf (D) and c-Maf (G). DAPI visualized cell nuclei (E,H,K). Green fluorescence of GFP depicts electroporated cells (C,F,I). This figure is representative of at least three independent experiments.