![]() Figure 3 of
Lin, Mol Vis 2007;
13:243-251.
Figure 3 of
Lin, Mol Vis 2007;
13:243-251.
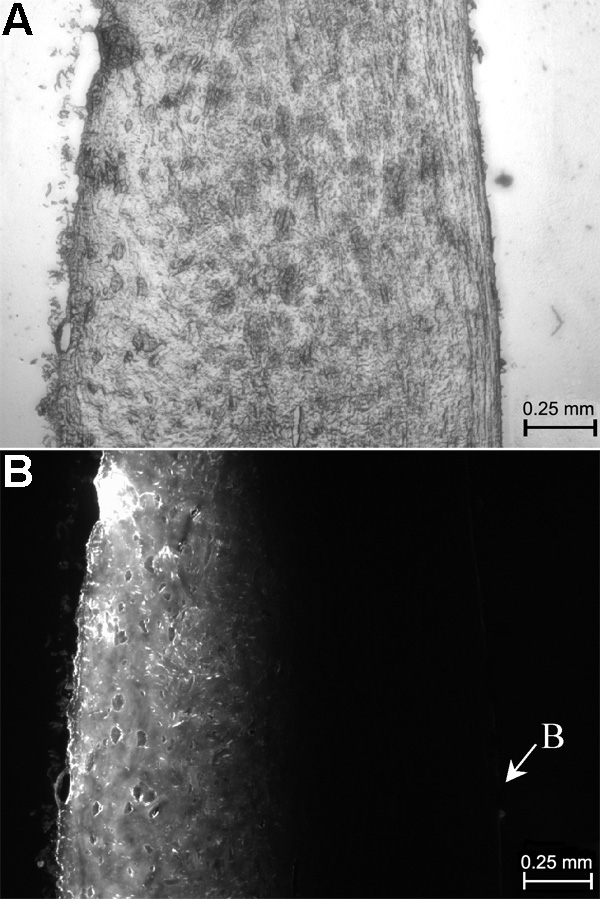
Figure 3. Spatial distribution of sodium fluorescein (NaF) in the sclera
The sclera was frozen and sectioned into 10 μm slices when the mixture of NaF (5 mg/ml) and ethacrynic acid (ECA; 0.6 mM) diffused through it for 6 h. Images of a typical section with trans- and epi-illuminations are shown in A and B, respectively. In B, B indicates the right boundary of the tissue section. The normalized distribution of the fluorescence intensity in the epi-illuminated section is shown as open circles in C. It was a function of penetration depth of NaF from the left to the right. The data points were fit by the normalized total concentration of NaF at 6 h in the sclera (Ct), based on the mathematical model described in the Methods section. The result of curve-fitting is shown as the solid curve in C.