![]() Figure 2 of
Lin, Mol Vis 2007;
13:243-251.
Figure 2 of
Lin, Mol Vis 2007;
13:243-251.
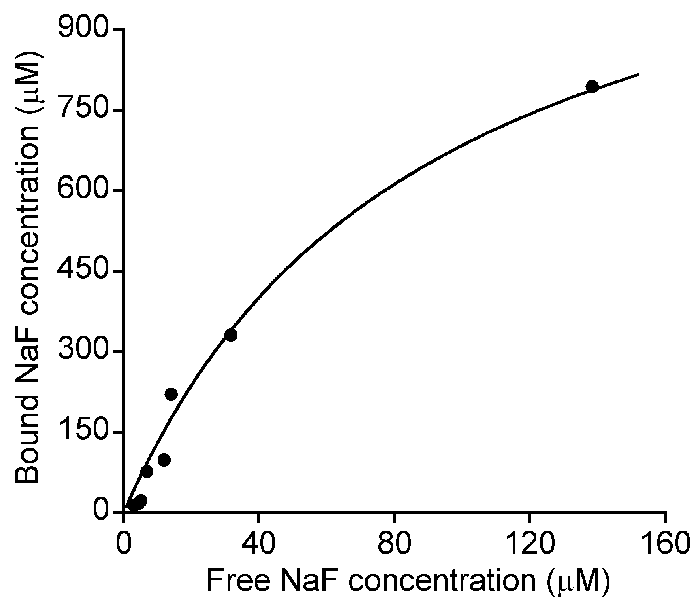
Figure 2. Equilibrium binding of sodium fluorescein (NaF) to enzymatically digested scleral tissue in the dialysis experiment
The concentration of bound NaF was determined as a function of the concentration of unbound (or free) NaF in the dialysis tubing. In the experiments, the concentration of scleral tissue in the dialysis tubing was 30 mg/ml. The symbol represents the data from experiments with 9 different initial concentrations of NaF in the dialysis tubing. The solid curve shows the nonlinear curve-fitting based on Equation 5, which yielded the values of Bmax and KD for NaF to be 1.44 mM and 0.11 mM, respectively.
