![]() Figure 4 of
Bentley, Mol Vis 2007;
13:237-242.
Figure 4 of
Bentley, Mol Vis 2007;
13:237-242.
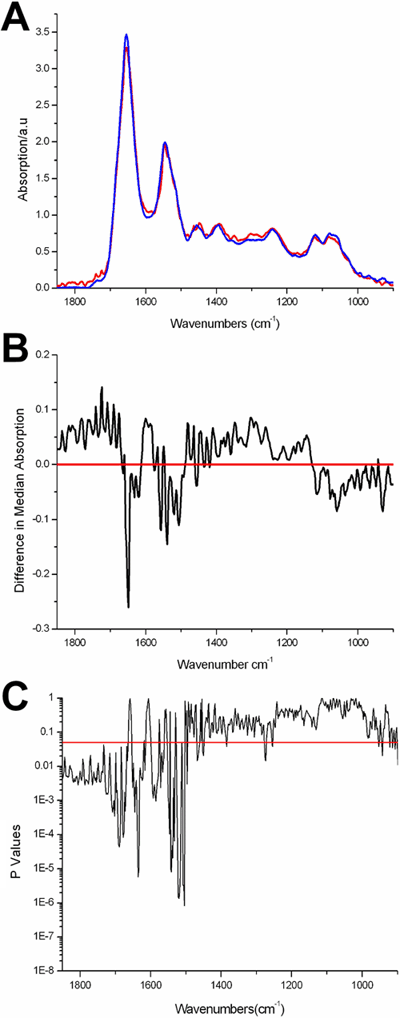
Figure 4. The SC and TA cell median spectra, the difference spectra, and the statistically significant regions of SC and TA cell spectra
Synchrotron FTIR microspectrosopic comparison of SC and TA cell populations in human cornea (A). Median spectra for SC (red) and TA (blue) cell populations. B: The difference spectra between the SC and TA cell populations. C: Significance values for Mann-Whitney comparison of SC and TA spectra (p<0.05 below line).
