![]() Figure 3 of
Young, Mol Vis 2007;
13:2328-2333.
Figure 3 of
Young, Mol Vis 2007;
13:2328-2333.
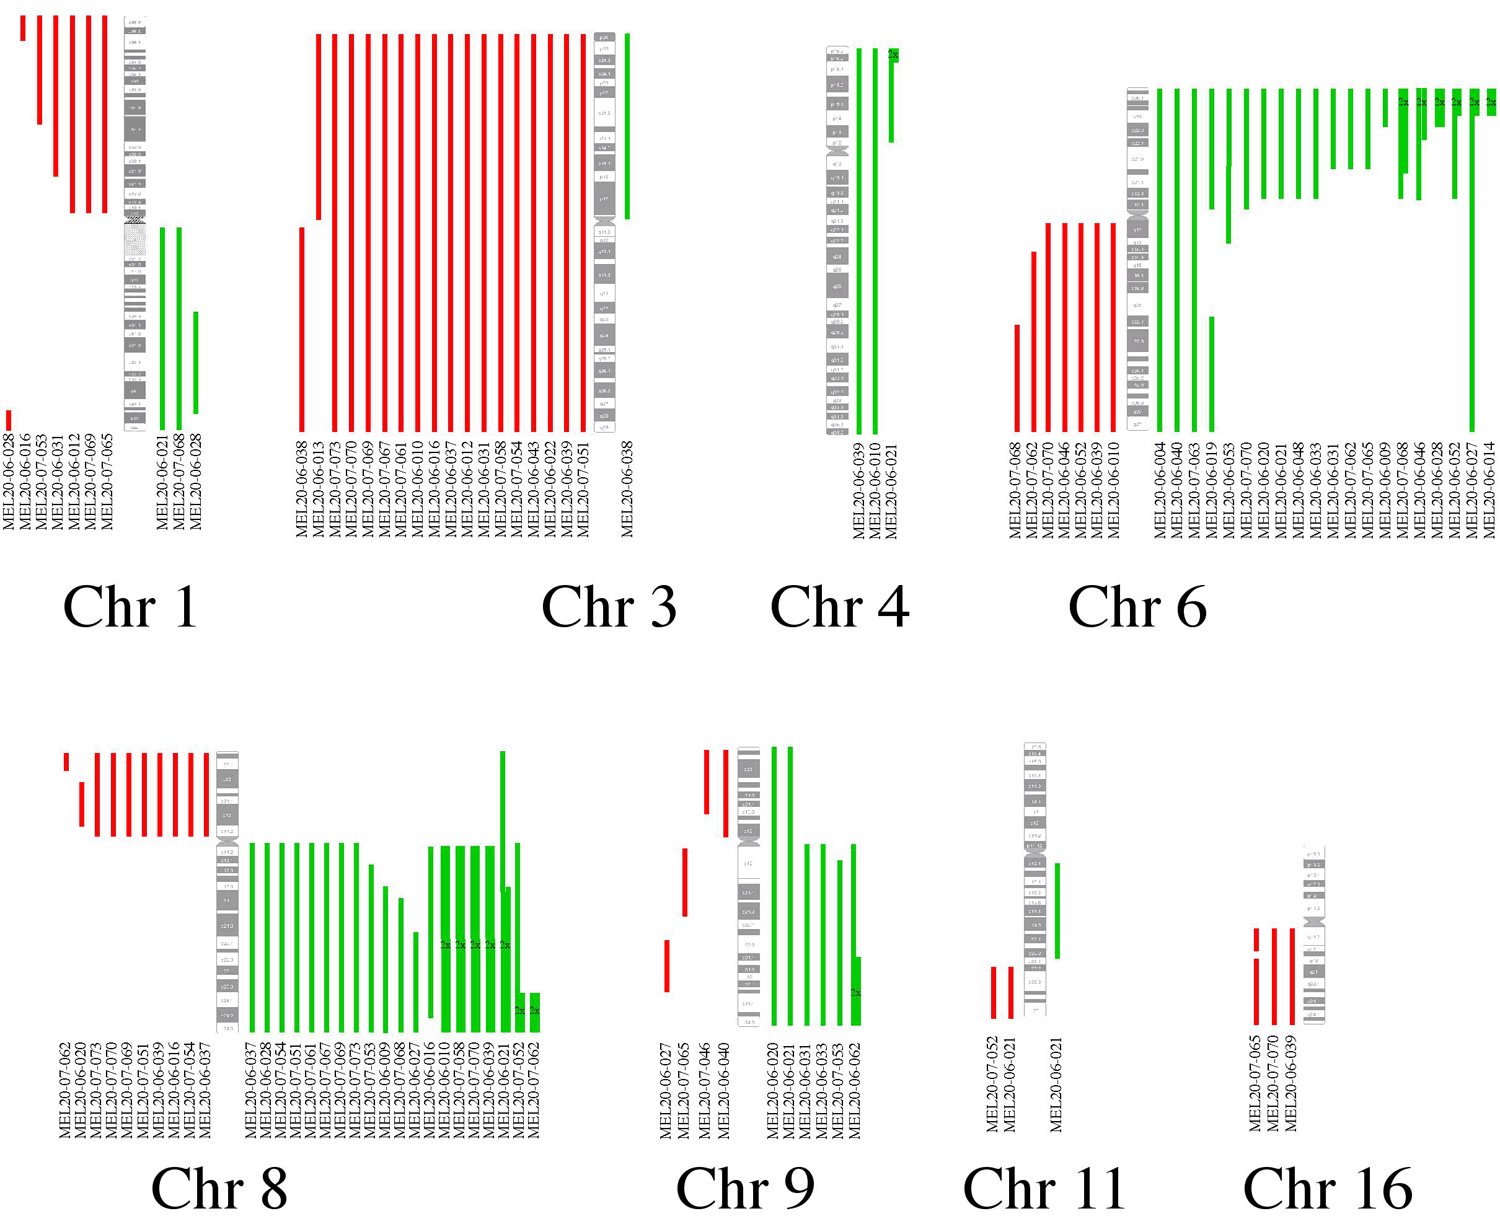
Figure 3. Frequency and extent of chromosomal gains and losses by high-density genome single nucleotide polymorphism mapping array in fine needle aspiration specimens
Graphical alignment of chromosomal gain and loss data from GeneChip 500k NspI mapping arrays is shown. Losses are to the left of each ideogram and are denoted in red. Gains are to the right and are denoted in green. Wide green bars labeled 2X denote regions of two-copy gain. Only those chromosomes that demonstrated instability in three or more tumors are depicted.
