![]() Figure 2 of
Young, Mol Vis 2007;
13:2328-2333.
Figure 2 of
Young, Mol Vis 2007;
13:2328-2333.
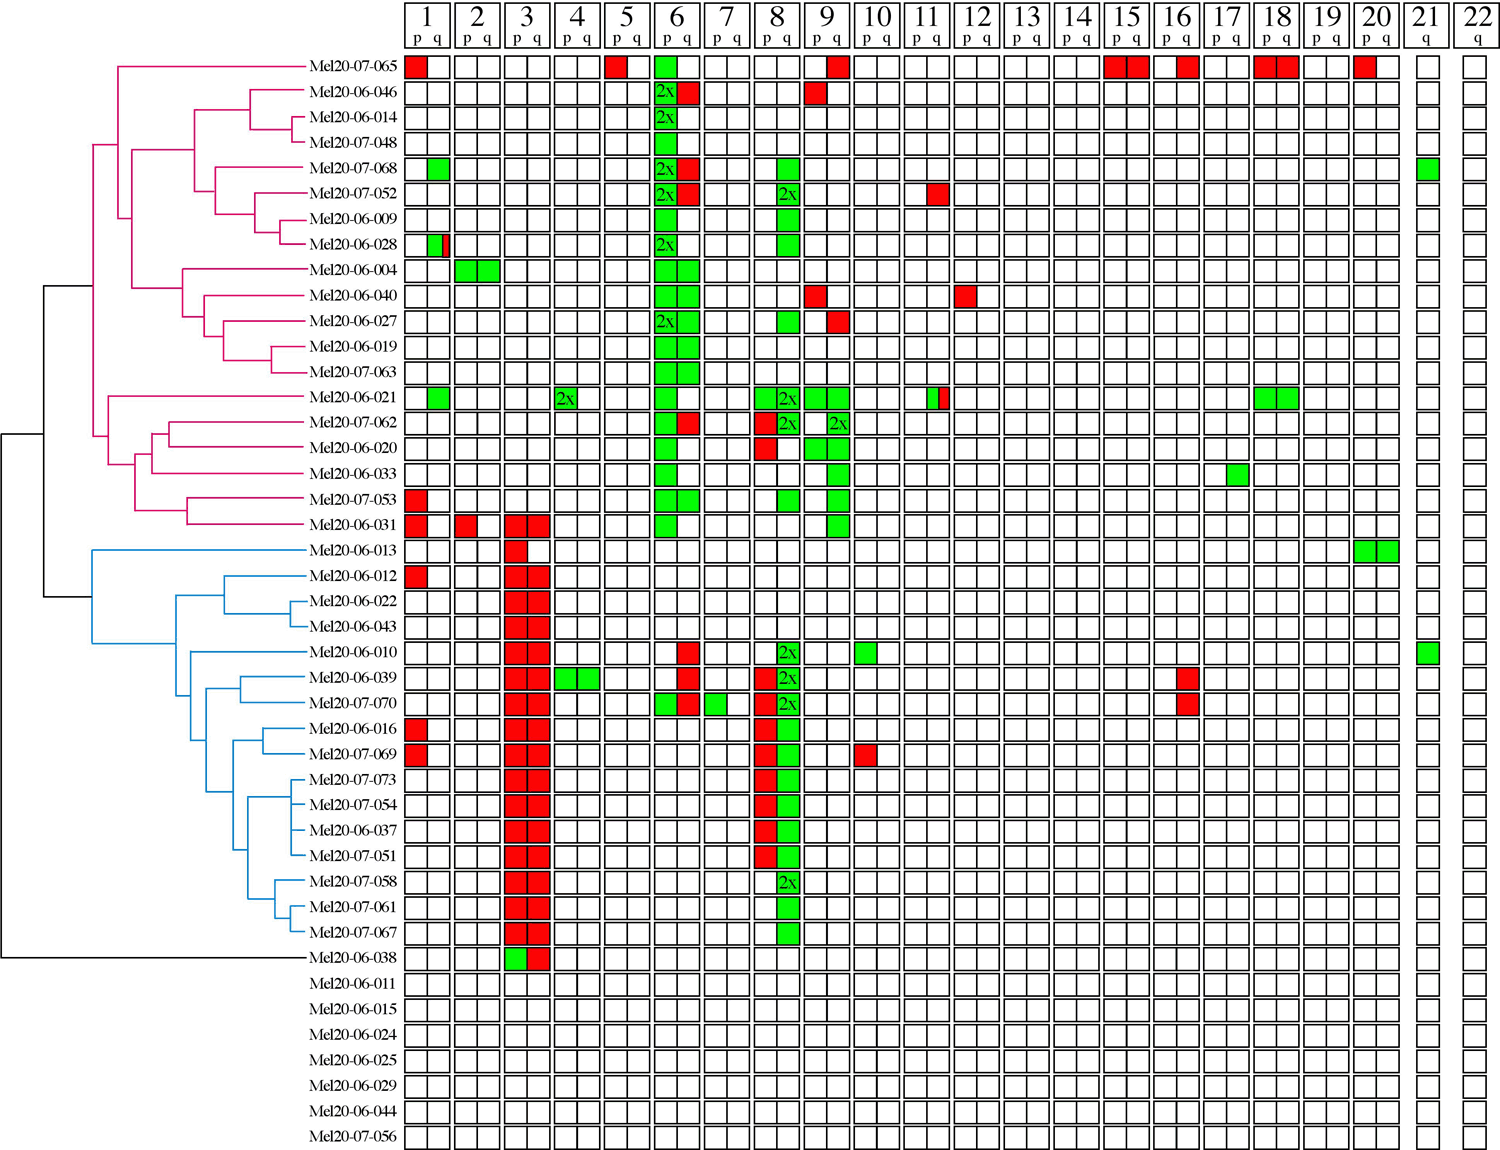
Figure 2. Chromosomal aberration determined by high-density genome single nucleotide polymorphism mapping array in fine needle aspiration specimens
Summary of accumulated chromosomal gain and loss data from GeneChip 500k NspI mapping arrays for 43 biopsies is demonstrated. Array data were processed using CNAT v4.0.1. Sample organization into a dendrogram used (1-Pearson correlation matrix) as input of average linkage hierarchical clustering. Red boxes denote whole or partial loss; green boxes denote a whole or partial gain; green boxes labeled 2X denote a two-copy gain.
