Figure 6. Relative mRNA of c-mer proto-oncogene tyrosine kinase in ARPE19 cells cultured on younger or older Bruch’s membrane measured
with Affymetrix DNA microarray (probe ID 40648_at). Data represent average of five replicates with each experimental group.
The differences were statistically significant (p= 0.026). Error bar represents standard deviation.
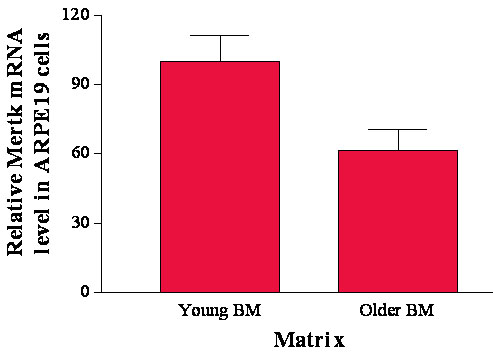
 Figure 6 of
Sun, Mol Vis 2007; 13:2310-2319.
Figure 6 of
Sun, Mol Vis 2007; 13:2310-2319.