![]() Figure 5 of
Murugesan, Mol Vis 2007;
13:2301-2309.
Figure 5 of
Murugesan, Mol Vis 2007;
13:2301-2309.
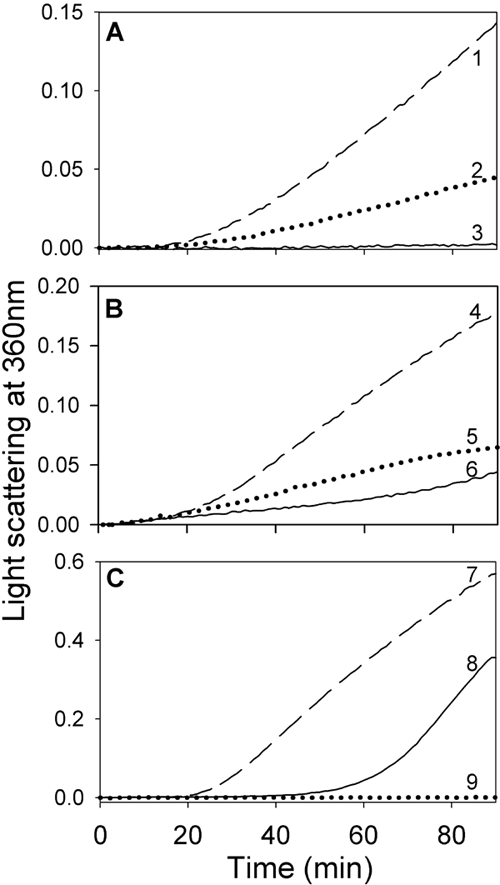
Figure 5. Chaperone activity of the proteins measured with different substrates
The assays were performed as described under methods. A: Thermal aggregation of CS in the absence or presence of wild-type or αAG98R proteins. In each experiment 75 μg of CS was used. Curve 1, CS alone; Curve 2, CS + 25 μg of wild-type αA-crystallin; Curve 3, CS + 25 μg of αAG98R. B: EDTA-induced aggregation of ADH in the absence or presence of wild-type or αAG98R at 37 °C. In each experiment 250 μg of ADH was used. Curve 4, ADH alone; Curve 5, ADH + 25 μg of wild-type αA-crystallin; Curve 6, ADH + 25 μg of αAG98R. C: DTT-induced aggregation of α-lactalbumin in the absence or presence of wild-type or αAG98R. In each experiment 400 μg of αLA was used. Curve 7, αLA alone; Curve 8, αLA + 100 μg of αAG98R; Curve 9, αLA + 100 μg of wild-type αA-crystallin.