![]() Figure 4 of
Murugesan, Mol Vis 2007;
13:2301-2309.
Figure 4 of
Murugesan, Mol Vis 2007;
13:2301-2309.
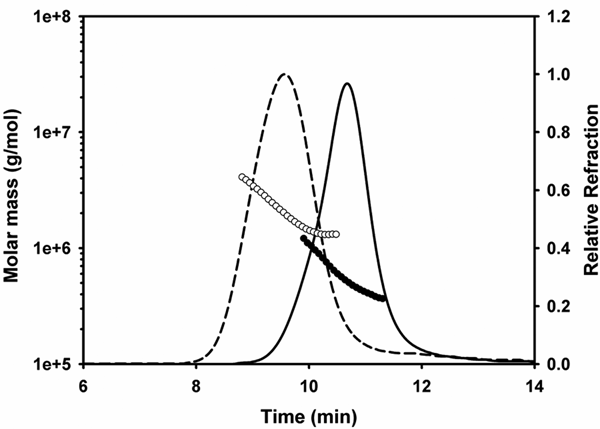
Figure 4. Molar mass distribution of αAG98R and wild-type αA-crystallin
αAG98R (open circle and broken line) and wild-type α-crystallin (closed circle and solid line), 0.1 mg protein each in phosphate buffer were injected into a TSK5000 gel filtration column connected to a multi-angle light scattering instrument and the data was analyzed as described under methods.