![]() Figure 3 of
Nallasamy, Mol Vis 2007;
13:229-236.
Figure 3 of
Nallasamy, Mol Vis 2007;
13:229-236.
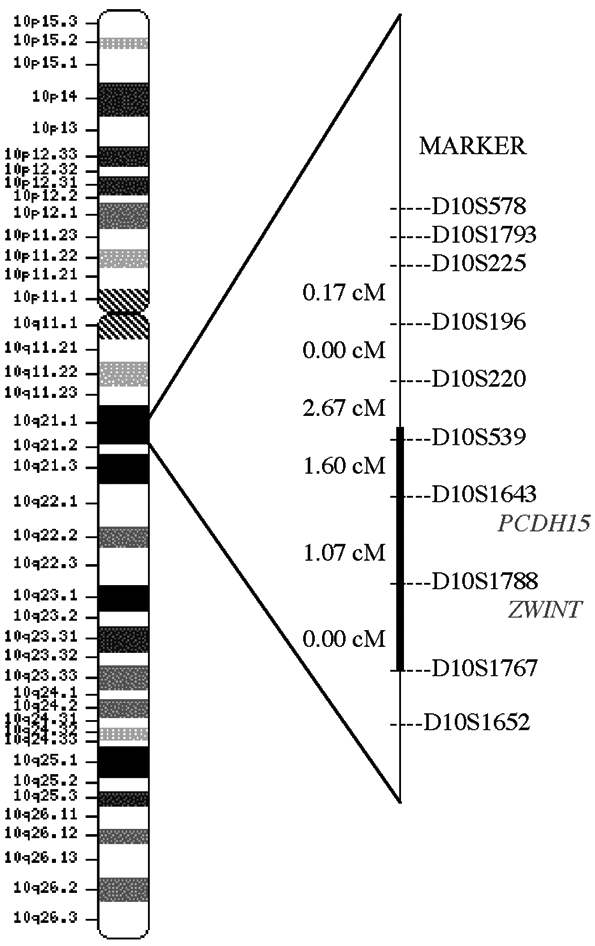
Figure 3. Schematic representation of a linkage map of microsatillite markers located at 10q21.1
The mapping order and genetic distances (in centiMorgans [cM]) were primarily obtained from the human genetic map of the Marshfield Center for Medical Genetics. The bold segment denotes the linked interval determined by multipoint linkage and haplotype analysis.
