![]() Figure 7 of
Zhang, Mol Vis 2007;
13:2289-2300.
Figure 7 of
Zhang, Mol Vis 2007;
13:2289-2300.
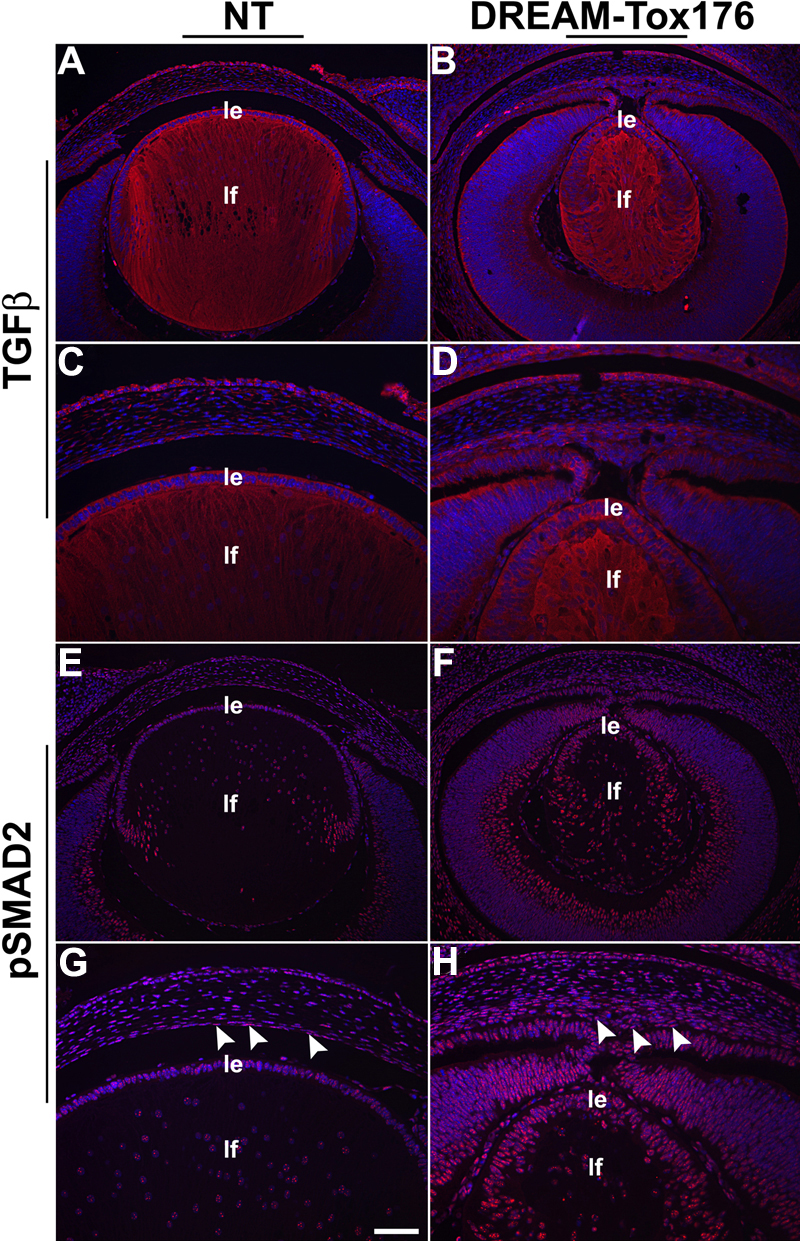
Figure 7. TGFβ2 and phospho-SMAD2 assays.
Immunohistochemistry was performed on E15.5 ocular sections to detect expression of TGFβ2 (A-D) and phospho-SMAD2 (E-H). The antibody staining is in red and the blue DAPI stain marks the nuclei. Panels C, D and G, H are higher magnifications of panels A, B and E, F. Expression of TGFβ2 is similar in Tox176 (B and D) and nontransgenic lenses (A and C). Levels of phospho-SMAD2 in the nuclei of mesenchymal cells in the posterior part of the cornea where the corneal endothelium would form appear to be comparable (G and H, arrows). Abbreviations; le, lens epithelial cells; lf, lens fiber cells. Scale bar (G) represents 100 μm in A, B and E, F and 50 μm in C, D and G, H.