![]() Figure 3 of
Zhang, Mol Vis 2007;
13:2289-2300.
Figure 3 of
Zhang, Mol Vis 2007;
13:2289-2300.
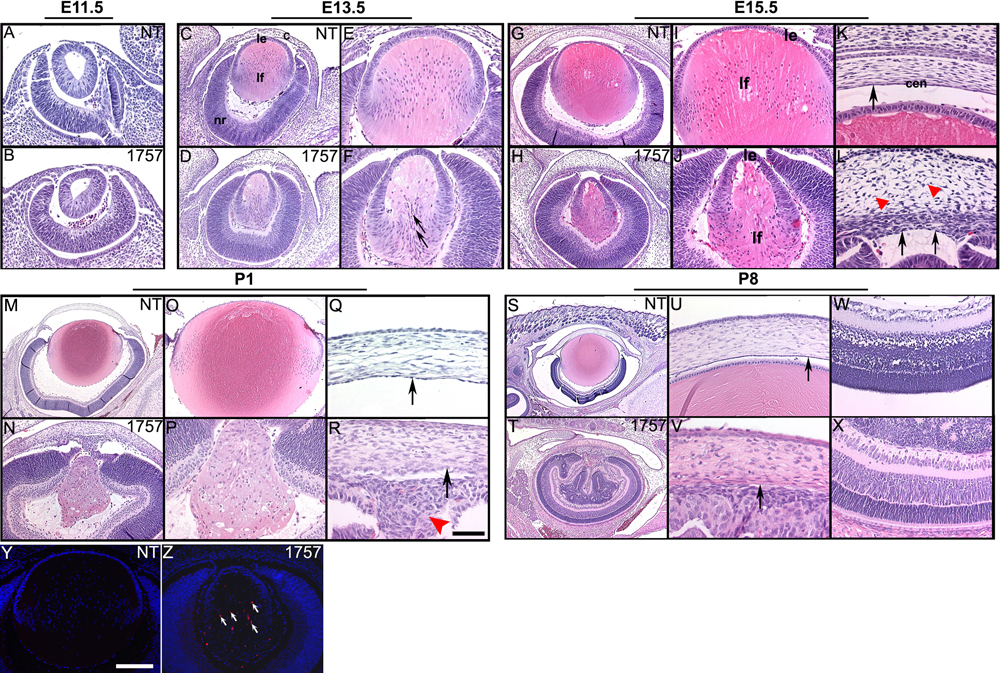
Figure 3. Altered ocular morphology.
Embryonic (E11.5, E13.5, and E15.5; A-K) or postnatal day heads (P1 and P8; MX) were sectioned and stained with hematoxylin and eosin. E and F are higher magnifications of C and D, respectively. A similar scheme is followed for the other panels. Altered fiber cell elongation and fiber cell degeneration is seen beginning at E13.5 (F, arrows). By P8, there is almost a complete loss of the lens (T). The Tox176 mice lacked a differentiated corneal endothelial layer (compare K and L, Q and R, U and V, arrows). Disorganization of the corneal stromal cells is highlighted at E15.5 (L, red arrowheads). At birth, a disorganized group of cells was seen between the cornea and the lens (R, red arrowhead). At P8, there was a complete absence of the aqueous and vitreal chambers (T). In the OVE1757 lenses, activated caspase-3 (red) was detected by immunohistochemistry in the degenerating fiber cells (Z). The nontransgenic control is shown in panel Y. DAPI staining (blue) was used in Y and Z to mark the nuclei. Abbreviations: c, cornea; le, lens epithelial cells; lf, lens fiber cells; NT, nontransgenic mice; cen, corneal endothelium. Scale bars in R and Y applies to A-X and Y-Z, respectively. Scale bar (R) represents 50 μm in A-B, E-J, P, U, W, V, and X; 100 μm in C, D, G, H, O, N; 200 μm in M, T, Y, Z; 400 μm in S and 25 μm in N. The scale bar (Y) represents 50 μm in Y and Z.