![]() Figure 2 of
Li, Mol Vis 2007;
13:2282-2288.
Figure 2 of
Li, Mol Vis 2007;
13:2282-2288.
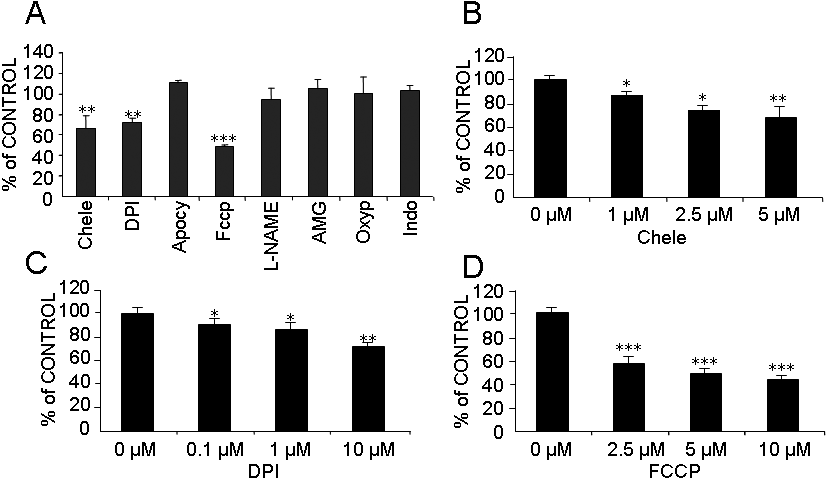
Figure 2. Sources of iROS in pTM cells induced by H2O2 treatment
Production of iROS after H2O2 treatment was determined by H2DCFDA. A:The following inhibitors were added to the cultures 1 h before H2DCFDA incubation: Chele; 5 μM, DPI; 10 μM, Apo; 10 μM, Fccp; 10 μM, L-NAME; 1 mM, AMG; 10 μM, Oxyp; 20 μM, and Indo; 200 μM. The data represent the mean ±SD (n=3) of iROS percentage change treated with inhibitors compared to controls treated with the same vehicles in which the inhibitors were prepared. Additional experiments were conducted to evaluate the dose response to Chele (B), DPI (C), and Fccp (D). An asterisk means p<0.05; a double asterisk means p<0.01; and three asterisks mean p<0.001 (n=3).
