![]() Figure 7 of
Banh, Mol Vis 2007;
13:2248-2262.
Figure 7 of
Banh, Mol Vis 2007;
13:2248-2262.
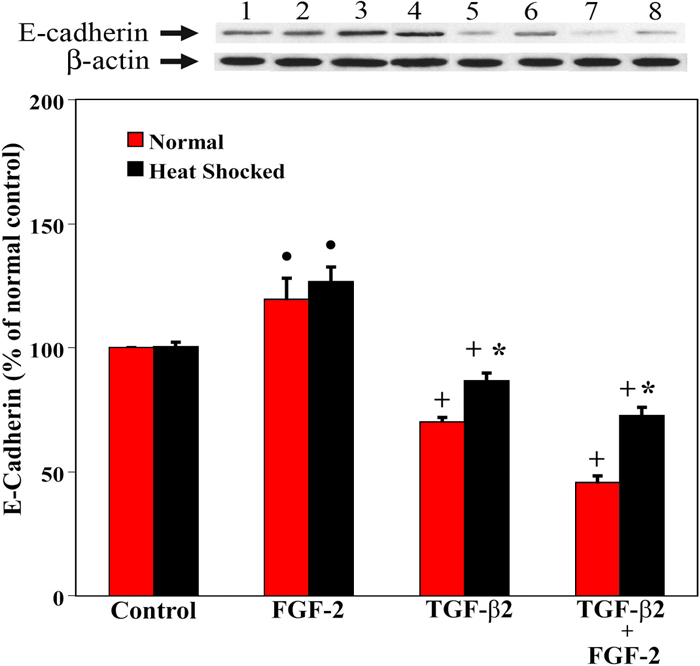
Figure 7. E-cadherin protein expression
A total of 12 lens epithelial explants from each of the eight treatment groups were used for western blot analysis of E-cadherin protein (120 kDa) expression. Control (lanes 1 and 2), FGF-2 (lanes 3 and 4), TGF-β2 (lanes 5 and 6), and TGF-β2/FGF-2 (lanes 7 and 8) lens epithelial explants under normal conditions (lanes 1, 3, 5, and 7) and after heat shocked treatment (lanes 2, 4, 6, and 8) are shown. β-Actin protein expression (42 kDa) serves as an internal control and is used to normalize the protein band intensity. The bar graph represents the E-cadherin protein expression (percent of normal control; ±SEM) for control, FGF-2, TGF-β2, and TGF-β2/FGF-2 treated lens epithelial explant extracts from normal culture and heat shocked conditions. Statistical analysis (ANOVA: p is less than or equal to 0.05) shows that there is a significant treatment effect. Both the normal control (100%) and heat shocked control (100.3%±1.8%) explants express similar levels of E-cadherin protein. FGF-2 treatment (normal, 119.5%±8.5%; heat shocked, 126.6%±5.9%) induced significant increase of E-cadherin expression when compared to the normal control epithelial explants (marked with the black dot). Both treatments with TGF-β2 (normal, 70.0%±1.8%; heat shocked, 86.7%±3.1%) and TGF-β2/FGF-2 (normal, 45.6%±2.6%; heat shocked, 72.6%±3.4%) demonstrate a significant decrease of E-cadherin protein expression with the greatest decrease of E-cadherin expression in the TGF-β2/FGF-2 explants (marked with the "+" sign). The asterisk indicates that the E-cadherin expression of heat shocked TGF-β2 and TGF-β2/FGF-2 explants are significantly higher than the same treatment groups under normal culture conditions.