![]() Figure 4 of
Banh, Mol Vis 2007;
13:2248-2262.
Figure 4 of
Banh, Mol Vis 2007;
13:2248-2262.
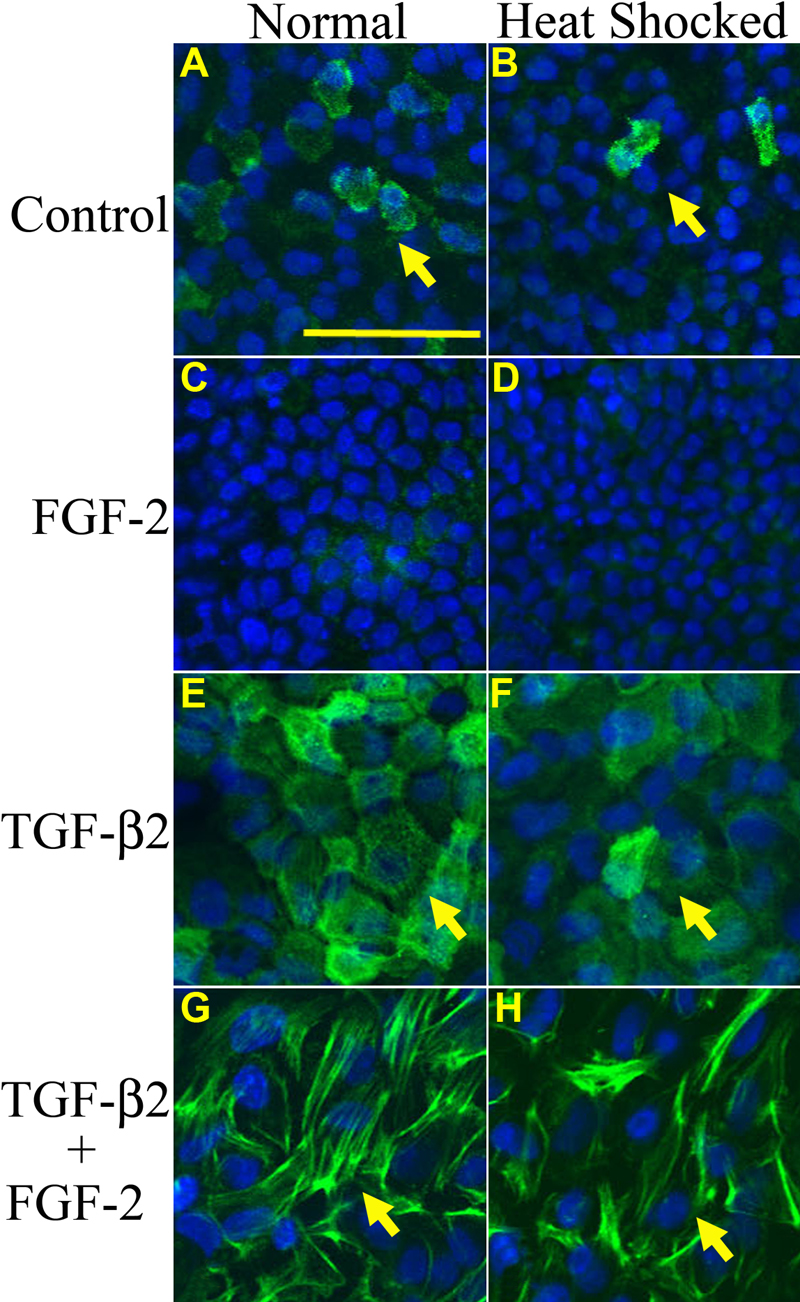
Figure 4. Immunohistochemical analysis of α-smooth muscle actin expression
The analysis of α-SMA immunoreactivity (Alexa fluor 488, green) using confocal microscopy. The cell nucleus is detected with DAPI staining (blue). Control (A and B), FGF-2 (C and D), TGF-β2 (E and F), and TGF-β2/FGF-2 (G and H) lens epithelial explants under normal conditions (A, C, E, and G) and after heat shocked treatment (B, D, F, and H) are shown (n=4 for each treatment group). Some control epithelial cells (A and B) show diffuse staining of α-SMA in the cytoplasm in a few cells while FGF-2 treated explants (C and D) show negligible α-SMA immunoreactivity. The TGF-β2-treated explants (E and F; arrows) demonstrate greater α-SMA immunoreactivity and more filamentous expression of α-SMA in the cytoplasm when compare to the controls (A and B). The simultaneous treatment of epithelial explants with TGF-β2 and FGF-2 (G and H; arrows) induced the greatest α-SMA immunoreactivity with the formation of substantially longer and extended α-SMA filaments in the plaques. The heat shocked epithelial explants (B, F, and H) show significantly lower α-SMA immunoreactivity than the same treatment groups under normal culture conditions (A, E, and G, respectively). The scale bar represents 50 μm.