![]() Figure 3 of
Banh, Mol Vis 2007;
13:2248-2262.
Figure 3 of
Banh, Mol Vis 2007;
13:2248-2262.
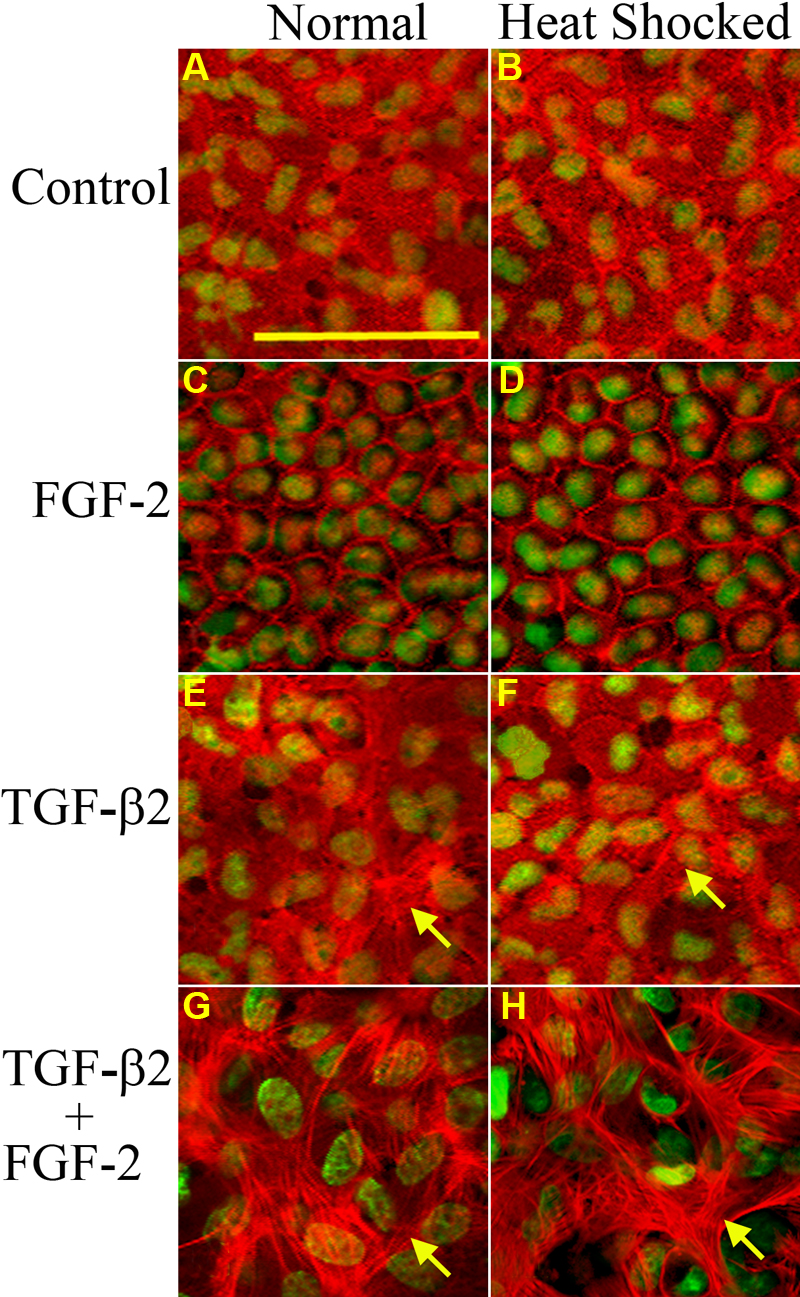
Figure 3. Immunohistochemical analysis of F-actin expression
F-actin was stained with Alexa 546 phalloidin and analyzed by confocal microscopy. F-actin fibers are represented by the red staining while DAPI staining of the nuclei are represented by the green color palette. Control (A and B), FGF-2 (C and D), TGF-β2 (E and F), and TGF-β2/FGF-2 (G and H) lens epithelial explants under normal conditions (A, C, E, and G) and after heat shocked treatment (B, D, F, and H) are shown (n=4 for each treatment group). Control epithelial cells (A and B) show normal expression of F-actin while FGF-2 treated explants (C and D) show significant decrease of F-actin immunoreactivity in the cytoplasm. FGF-2 treated explants show F-actin staining mainly around the cell borders. On the one hand, the TGF-β2-treated explants (E and F) demonstrate a slight increase (arrows) of F-actin immunoreactivity and stress fiber extension when compared to the controls (A and B). On the other hand, the simultaneous treatment of epithelial explants with TGF-β2 and FGF-2 (G and H) induced the formation of substantially longer peripheral extensions of F-actin filaments in the plaques (arrows). There is no significant difference of F-actin immunoreactivity between the normal culture explants (A, C, E, and G) and heat shocked explants (B, D, F, and H). The scale bar represents 50 μm.