![]() Figure 11 of
Banh, Mol Vis 2007;
13:2248-2262.
Figure 11 of
Banh, Mol Vis 2007;
13:2248-2262.
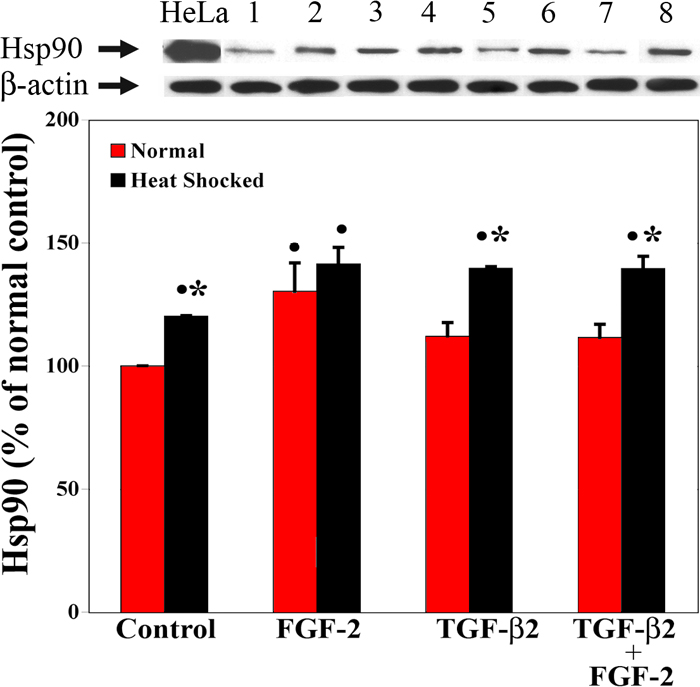
Figure 11. Hsp90 protein expression 24 h after treatment
A total of 12 lens epithelial explants from each of the eight treatment groups were used for western blot analysis of Hsp90 (90 kDa) protein expression. HeLa cell lysate (positive control), control (lanes 1 and 2), FGF-2 (lanes 3 and 4), TGF-β2 (lanes 5 and 6), and TGF-β2/FGF-2 (lanes 7 and 8) lens epithelial explants under normal conditions (lanes 1, 3, 5, and 7) and after heat shocked treatment (lanes 2, 4, 6, and 8) are shown. β-Actin (42 kDa) protein expression serves as an internal control and is used to normalize the protein band intensity. The bar graph represents the Hsp90 protein expression (percent of normal control; ±SEM) for control, FGF-2, TGF-β2, and TGF-β2/FGF-2 treated lens epithelial explant extracts from normal culture and heat shocked conditions. Statistical analysis (ANOVA: p is less than or equal to 0.05) shows that there is a significant treatment effect. The FGF-2 (normal, 130.4%±11.4%; heat shocked, 141.4%±6.7%), heat shocked control (120.2%±0.2%), heat shocked TGF-β2 (139.6%±0.8%), and heat shocked TGF-β2/FGF-2 (139.5%±5.0%) explants show a significant increase of Hsp90 protein expression when compared to the normal control explants (100%). In contrast, Hsp90 expression of the normal conditioned TGF-β2 (112.0%±5.6%) and TGF-β2/FGF-2 (111.5%±5.4%) explants show no significant difference when compared to the normal control (marked with a black dot). An asterisk indicates that the Hsp90 expression of heat shocked control, TGF-β2, and TGF-β2/FGF-2 explants were significantly higher than the same treatment groups under normal culture conditions, while there was no significant difference between the normal and heat shocked FGF-2 treated explants.