![]() Figure 7 of
Park, Mol Vis 2007;
13:2222-2232.
Figure 7 of
Park, Mol Vis 2007;
13:2222-2232.
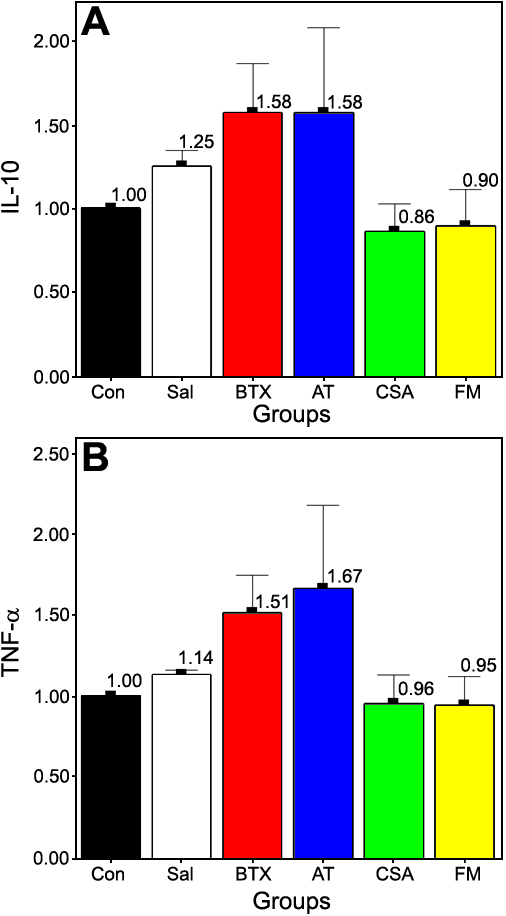
Figure 7. Real time reverse-transcriptase polymerase chain reaction for interleukin 10 and tumor necrosis factor alpha
Real time RT-PCR for IL-10 (A) and TNF-α (B) revealed no significant differences in gene expression in all groups. The relative expression levels were calculated by the comparative Ct method setting group Con as 1.00; n=7 in each group. The Kruskal-Wallis test using LSD after ranks was employed for statistical analysis.
