![]() Figure 4 of
Park, Mol Vis 2007;
13:2222-2232.
Figure 4 of
Park, Mol Vis 2007;
13:2222-2232.
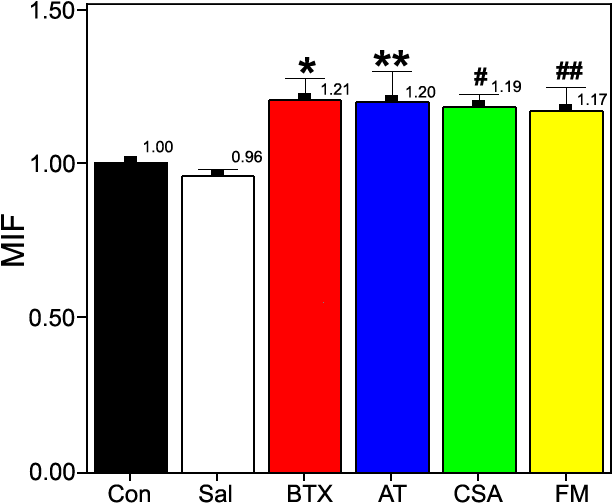
Figure 4. Real time reverse-transcriptase polymerase chain reaction for macrophage migration inhibitory factor
Real time RT-PCR revealed that MIF expression is elevated in the BTX-injected lacrimal glands (BTX, AT, CSA, and FM) compared to non-injection or saline injection groups. This elevation was not affected by topical treatment (AT, CsA, and FM). The relative expression levels were calculated by the comparative Ct method with the setting group Con as 1.00; n=7 in each group. The p-value was calculated by Kruskal-Wallis test using LSD after ranks. The asterisk indicates a p=0.18 versus "con" and p=0.020 versus "Sal", the double asterisk indicates a p=0.49 versus "Con" and p=0.40 versus "Sal". The sharp (hash mark) indicates a p=0.09 versus "Con" and p=0.12 versus "Sal", the double sharp indicates a p=0.28 versus "Con" and p=0.27 versus "Sal".