![]() Figure 4 of
Kamphuis, Mol Vis 2007;
13:220-228.
Figure 4 of
Kamphuis, Mol Vis 2007;
13:220-228.
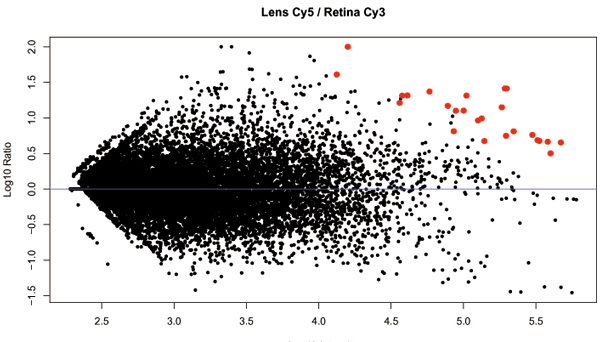
Figure 4. MA plot
Vertical axis represents log10 Cy5 (lens)/Cy3 (retina). Horizontal axis represents log10 average intensity of both channels. Red data points show the position of the 25 features found in the cluster.
