![]() Figure 3 of
Kamphuis, Mol Vis 2007;
13:220-228.
Figure 3 of
Kamphuis, Mol Vis 2007;
13:220-228.
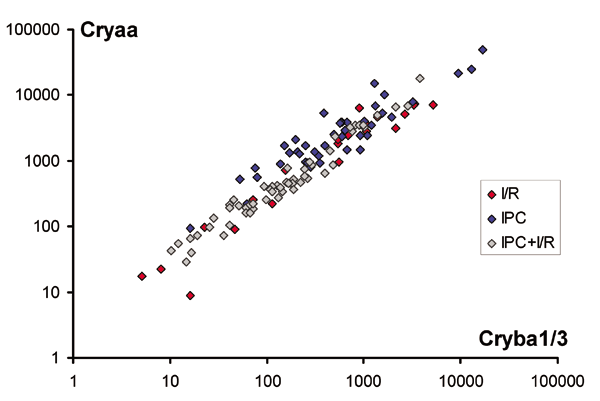
Figure 3. Correlation plot for Cryaa and Cryba1/3 transcript levels in retinal cDNA samples as an example for the high correlation in transcript levels of the cluster genes
All samples of the combined data set were included (R2=0.93). Note the overlap between the three experimental groups and the wide range of transcript levels found. Transcript levels were normalized against the levels of the four reference genes.
