![]() Figure 7 of
Mojumder, Mol Vis 2007;
13:2163-2182.
Figure 7 of
Mojumder, Mol Vis 2007;
13:2163-2182.
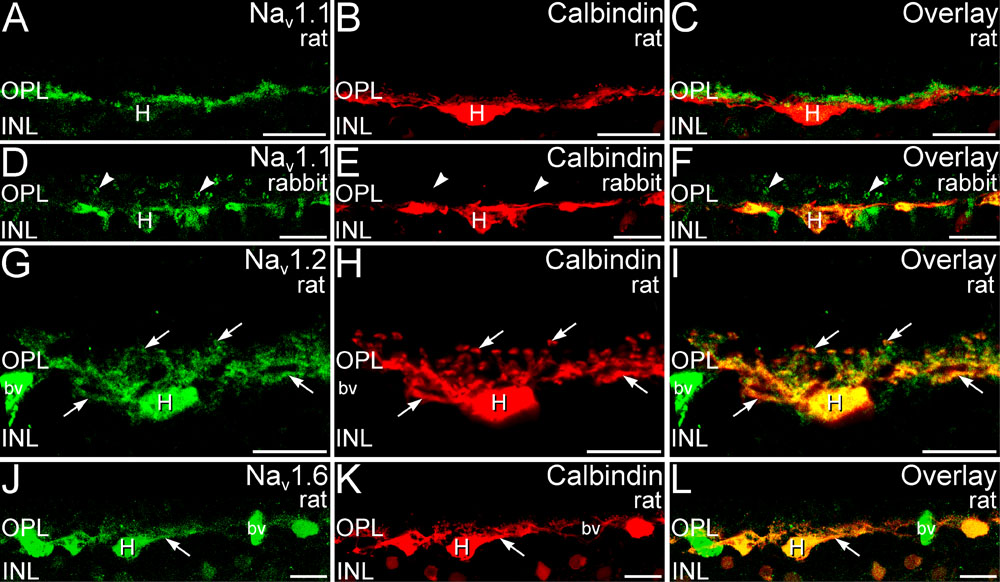
Figure 7. Distribution of Nav1.1, Nav1.2, and Nav1.6 in horizontal cells and the outer plexiform layer
Double labeling using isoform-specific antibodies directed against Nav1.1, Nav1.2, or Nav1.6 (green) and calbindin (red) was used to assess Nav a-subunit localization in horizontal cells. A-C: Labeling for Nav1.1 in the rat and mouse retina was most prominent in the distal outer plexiform layer (OPL; at retina shown). Rat and mouse horizontal cells and their processes showed only weak labeling for Nav1.1. D-F: Rabbit horizontal cell bodies (H) and processes showed distinct Nav1.1 labeling, in contrast to rat and mouse horizontal cells. Distinctive annuli of Nav1.1 labeling were present in the rabbit OPL (arrowheads). G-I: Labeling for Nav1.2 was present in horizontal cell bodies (H) and processes (arrows). Rat, mouse, and rabbit horizontal cells all showed similar labeling for Nav1.2 (rat retina shown). J-L: Much of the Nav1.6 labeling in the outer retina corresponded closely to horizontal cell bodies (H) and processes (arrows), although some additional diffuse labeling in the OPL was also present. Rat, mouse and rabbit horizontal cells all showed similar labeling for Nav1.6 (rat retina shown). Labeling of blood vessels (bv) is non-specific. The following abbreviations were used: outer nuclear layer (ONL); an inner nuclear layer (INL). Scale bars equal 10 μm for all panels.