![]() Figure 4 of
Mojumder, Mol Vis 2007;
13:2163-2182.
Figure 4 of
Mojumder, Mol Vis 2007;
13:2163-2182.
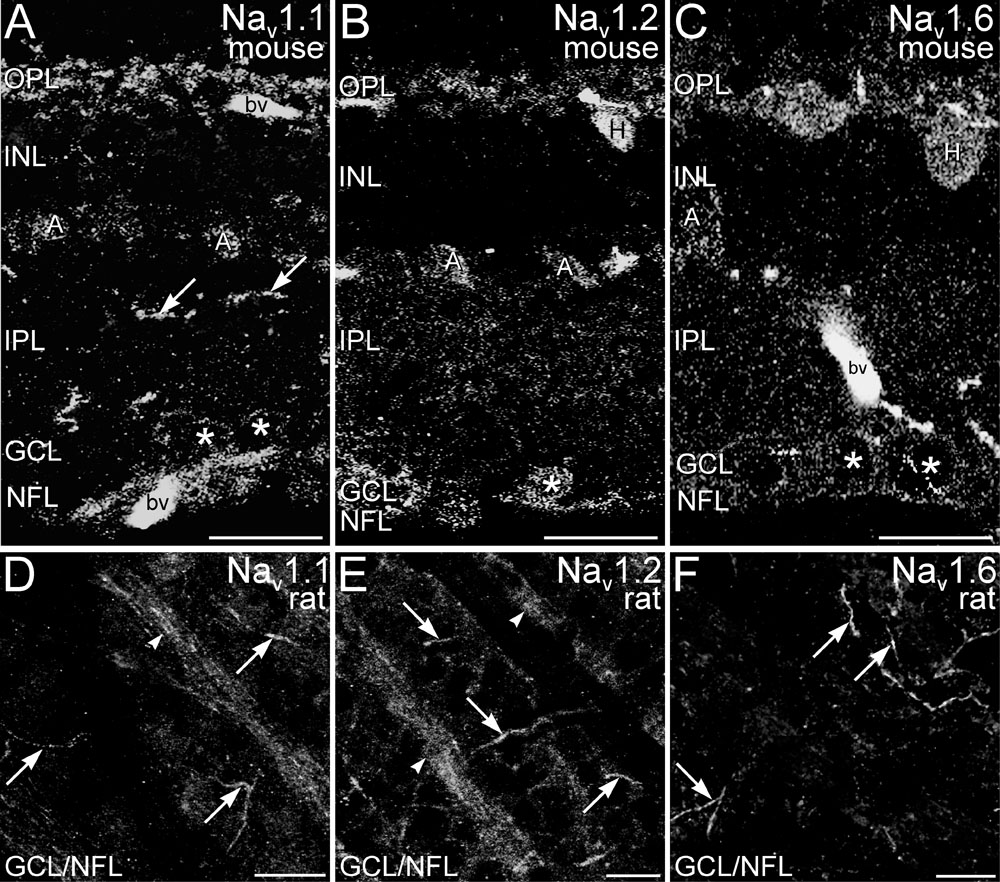
Figure 4. Labeling for Nav1.1, Nav1.2 and Nav1.6 is isoform-specific and consistent with the distribution of Pan-Nav labeling
A-C: Shown are labeling for Nav1.1, Nav1.2, and Nav1.6 in vertical retinal sections. Rat and mouse retina showed similar labeling patterns (mouse retina shown). Labeling of blood vessels (bv) was non-specific. A: Nav1.1 labeling in the outer plexiform layer (OPL) was characterized by discrete puncta surrounded by more diffuse labeling. A subset of putative amacrine cells (A) in the proximal inner nuclear layer (INL) also showed labeling. Large, intensely labeled processes (arrows) and diffuse labeling were present in the inner plexiform layer (IPL). Cells in the ganglion cell layer (GCL) were lightly labeled (*). Ganglion cell axons in the nerve fiber layer (NFL) also showed labeling. B: Nav1.2 labeling in the OPL was diffuse, but a few presumptive horizontal cell bodies (H) in the distal INL showed strong labeling. Some presumptive amacrine cells (A) in the proximal INL also showed Nav1.2 labeling. The IPL showed diffuse labeling. Cells in the GCL (*) also showed labeling. C: Nav1.6 labeling in the OPL was diffuse. Presumptive horizontal cell bodies (H) in the distal INL showed prominent labeling. A few presumptive amacrine cells (A) in the proximal INL showed labeling for Nav1.6. As expected, cells in the GCL (*) also were labeled. D-F: Confocal images of labeling for Nav1.1, Nav1.2, and Nav1.6 in wholemounted rat retina at the level of the GCL and NFL are illustrated. D: Labeling for Nav1.1 was present in ganglion cell axons (arrowhead) and putative initial segments (arrows). Weakly labeled cell bodies in the GCL also were visible. E: Labeling for Nav1.2 at this level was most prominent in ganglion cell axons (arrowheads) and structures with the appearance of initial segments (arrows). F: Structures corresponding to the putative initial segments of ganglion cell axons showed strong labeling for Nav1.6 (arrows), but relatively little labeling was present elsewhere in the axons or cell bodies of the cells in the GCL. Scale bars equal 20 μm for all panels.