![]() Figure 3 of
Mojumder, Mol Vis 2007;
13:2163-2182.
Figure 3 of
Mojumder, Mol Vis 2007;
13:2163-2182.
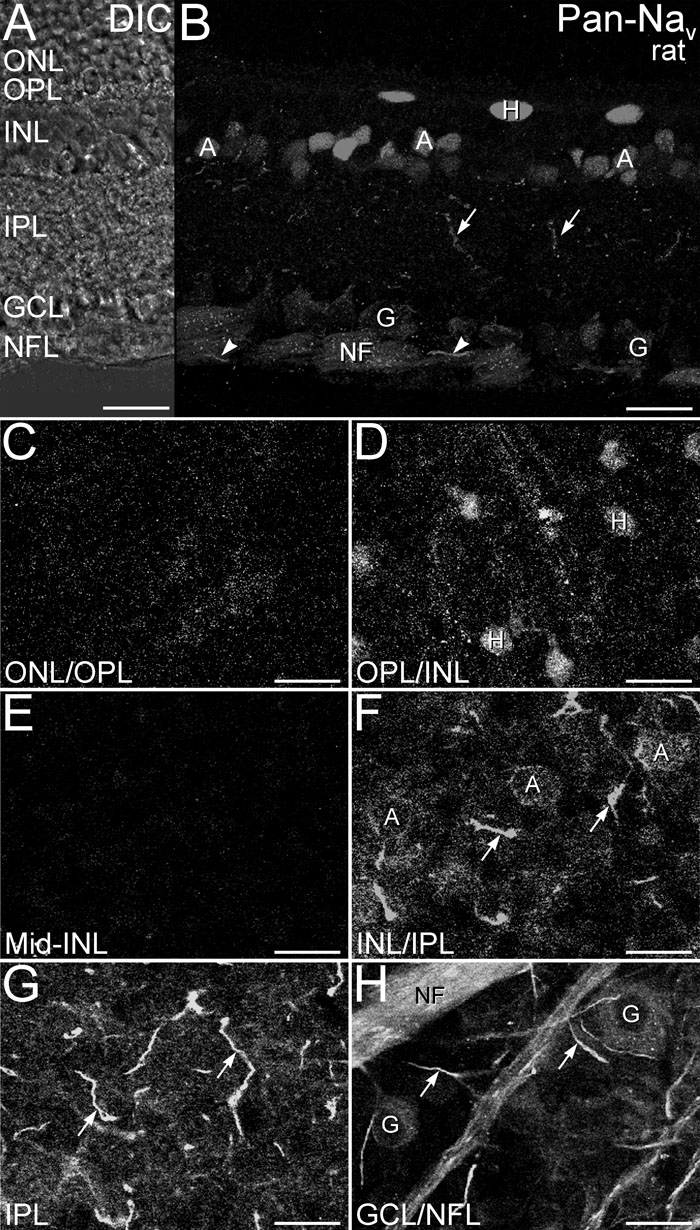
Figure 3. Pan-Nav labeling in the rat retina
A-B: Pan-Nav immunolabeling in a shown in a projection of confocal images through a vertical cryosection (projection of 44 optical planes; 6.27 μm total thickness). A: Differential interference contrast (DIC) image showing retinal layers. B: Pan-Nav immunolabeling was present in the cell bodies of amacrine cells (A) in the proximal inner nuclear layer (INL) and putative horizontal cells (H) at border of the INL and the outer plexiform layer (OPL). Labeling was also present in large, morphologically distinct processes (arrows) in the inner plexiform layer (IPL). Cell bodies of ganglion cells (G) and axons (arrowheads) also showed labeling. Photoreceptor cell bodies in the outer nuclear layer (ONL) did not show labeling. C-H: Pan-Nav immunolabeling at different levels in retinal wholemount is shown (in single optical sections). C: At the level of the ONL/OPL border only diffuse labeling was present. D: At the OPL/INL border, cell bodies and processes of putative horizontal cells (H) and processes showed Pan-Nav labeling. Additional diffuse Pan-Nav labeling also was present. E: The cell bodies of bipolar and Müller cells in the mid-INL did not show Pan-Nav labeling. F: Many amacrine cells (A) at the INL/IPL border show Pan-Nav labeling. Strong Pan-Nav labeling was present in morphologically distinct processes coursing in the distal IPL (arrows). Substantial diffuse Pan-Nav labeling was associated with other processes in the distal IPL. G: Deeper in the IPL, a similar distribution of strongly labeled processes (arrows) and diffuse labeling was evident. H: Pan-Nav labeling at the border of the ganglion cell layer (GCL) and nerve fiber layer (NFL) is shown. Many cells in the GCL show Pan-Nav labeling, including a prominently labeled set of large ganglion cells (G). Ganglion cell axon bundles (NF) in the nerve fiber layer (NFL) also showed strong Pan-Nav labeling. Structures similar in appearance to axon initial segments also showed strong labeling (arrows). Scale bars equal 20 μm for all panels.