![]() Figure 4 of
Morita, Mol Vis 2007;
13:2119-2128.
Figure 4 of
Morita, Mol Vis 2007;
13:2119-2128.
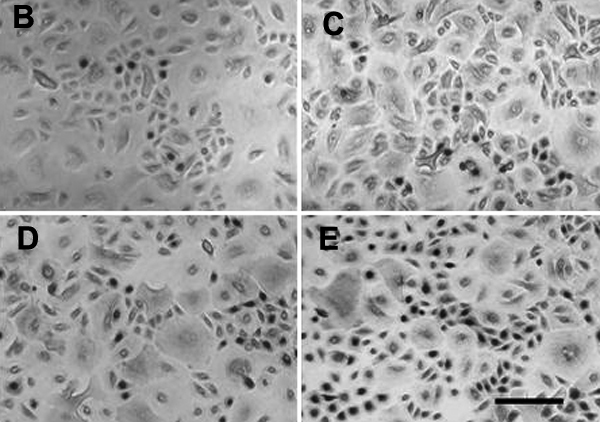
Figure 4. Effect of epiregulin on BrdU incorporation into HCECs
Serial concentrations of epiregulin were added to the medium, and after 48 h the incorporation of BrdU was determined by counting the number of BrdU labeled cells/5 mm2. The bottom panel shows representative photographs of BrdU labeled cells. (B: 0 ng/ml, C: 1 ng/ml, D: 5 ng/ml, E: 10 ng/ml). The scale bar is equal to 200 μm. Asterisks show a significant difference (p<0.01) from the corresponding control (no addition of epiregulin). P values were calculated by two-sample t test. Results are representative of four independent experiments.