![]() Figure 3 of
Morita, Mol Vis 2007;
13:2119-2128.
Figure 3 of
Morita, Mol Vis 2007;
13:2119-2128.
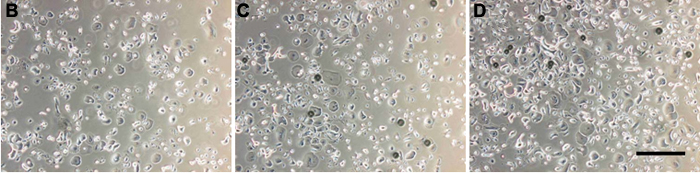
Figure 3. Effects of epiregulin on the proliferation of HCECs
Serial concentrations of recombinant epiregulin were added to the medium, and after 6 days the cell numbers were counted using a hemocytometer. The bottom panel shows representative photographs of HCECs 6 days after the addition of epiregulin. (B: 0 ng/ml, C: 1 ng/ml, D: 10 ng/ml) The scale bar is equal to 400 μm.