![]() Figure 4 of
Roger, Mol Vis 2007;
13:206-219.
Figure 4 of
Roger, Mol Vis 2007;
13:206-219.
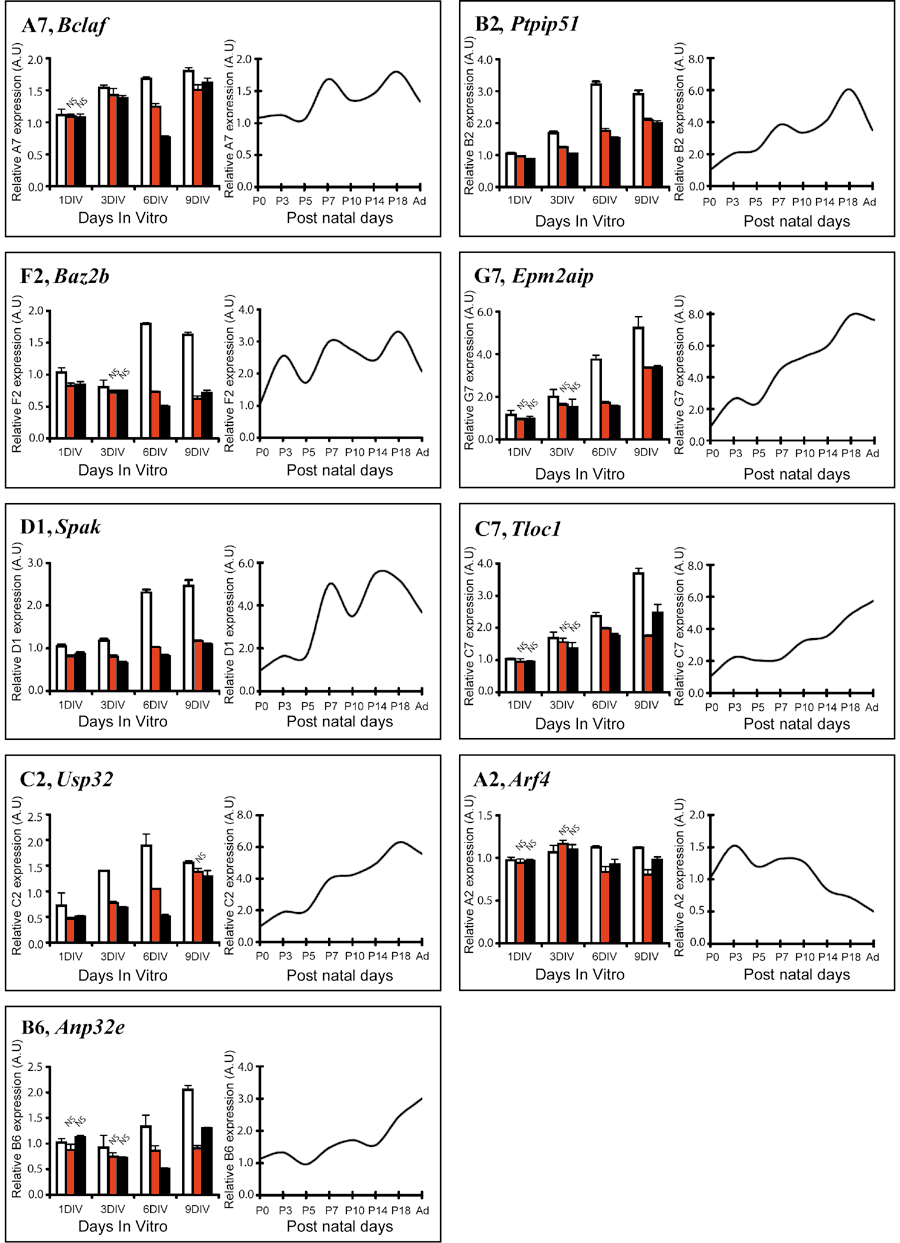
Figure 4. Relative level of differential DC6 cDNA expression after six days of cytokine treatment and during postnatal rat retinal development
Retinal explants from P0 rat were cultured with medium alone (white bars) or with 10 ng/ml of ciliary neurotrophic factor (CNTF; red bars) or leukemia inhibitory factor (LIF; black bars). Retinal explants were harvested after 1, 3, 6, and nine days in vitor (9DIV) and RNA extracted. cDNA expression corresponding to A7, F2, D1, C2, B6, B2, G7, C7, and A2 clones was analyzed by real-time RT-PCR. The histograms illustrate the mRNA expression corresponding to each clone normalized by S26. For each gene, all values were compared to mRNA expression of untreated rat retinal explants at 1DIV. Data are expressed as mean + SD from two independent experiments performed in triplicate. For each time points, values of CNTF- or LIF-treated samples were compared to time-matched control samples. All values were considered as significant (p<0.05) except for those marked NS (Not Significant). Rat retinas were harvested at P0, P3, P5, P7, P10, P14, P18, and adulthood and the RNA extracted. cDNA expression corresponding to A7, F2, D1, C2, B6, B2, G7, C7, and A2 clones was analyzed by real-time RT-PCR. The curves illustrate one representative experiment of the mRNA expression corresponding to each clone normalized by S26. For each gene, all values were compared to mRNA expression at P0.
