![]() Figure 6 of
Okamoto, Mol Vis 2007;
13:2112-2118.
Figure 6 of
Okamoto, Mol Vis 2007;
13:2112-2118.
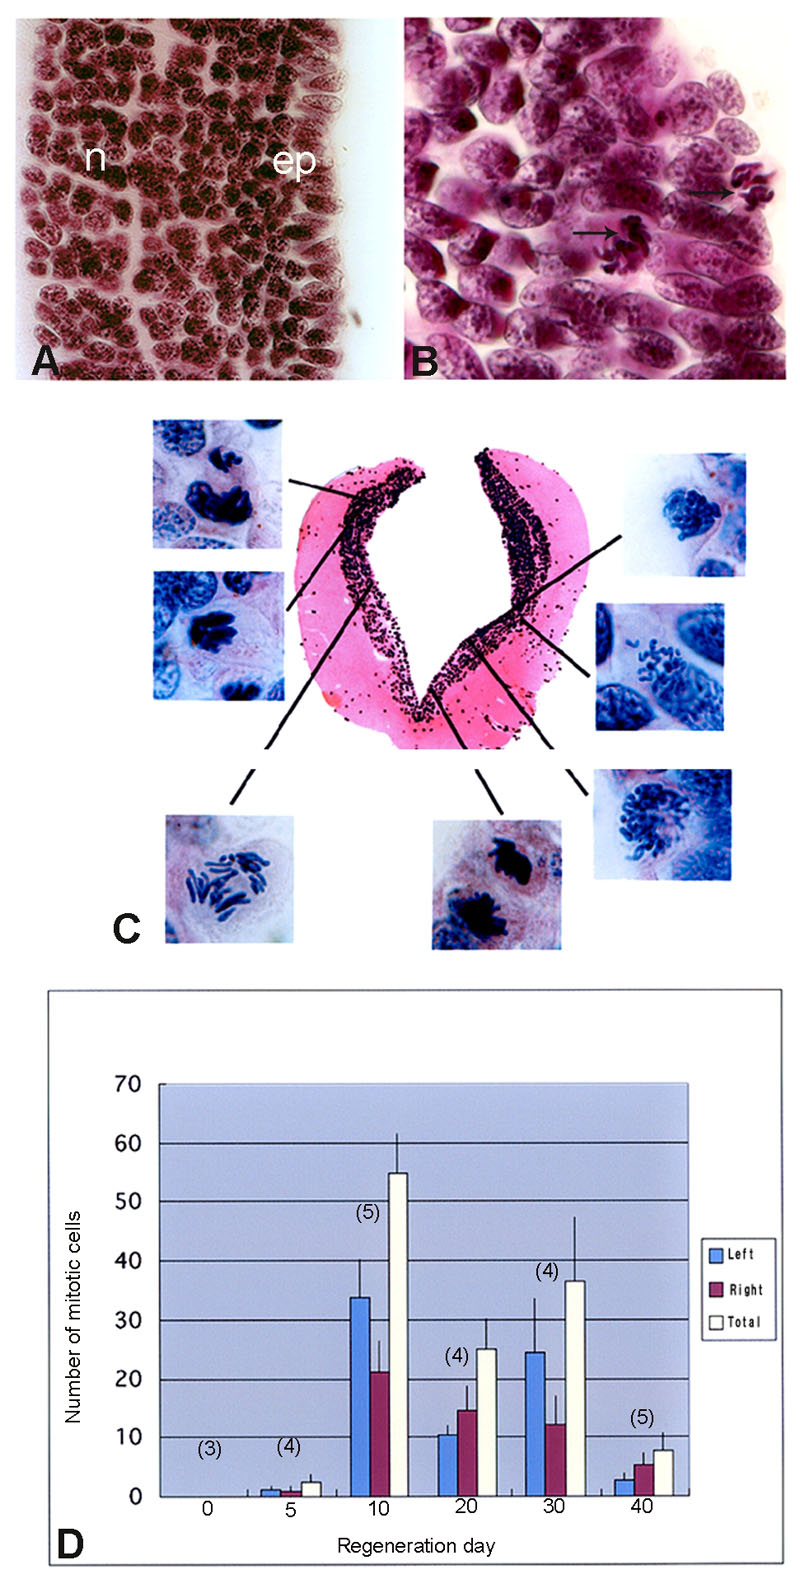
Figure 6. Cell proliferation in the midbrain during early regeneration stages
A: A normal midbrain coronal section. The marker n indicates the neuronal cell layer and ep marks the ependymal cell layer. The layer of nerve fibers is to the left of the neuronal cell layer and the ventricle is on the right side of the ependymal cell layer. B: At ten days postoperative, mitotic figures can be seen only in the ependymal cell layer. Unoperated control ependymal cells are composed of a single layer of cells. However, probably due to cellular growth, they form a multilayer by ten days post surgery (compare with A). C: A typical section of the midbrain at ten days post surgery. Many mitotic figures can be seen in the ependymal cell layer facing the ventricle. The pink stained area is the nerve fiber region. The neuronal cell layer and ependyma are stained violet. D: The change of the mitotic cell numbers counted in serial sections of the midbrain during early stage of regeneration. Blue represent cells in the left part of the brain, red represent cells on the right portion and white is the total number. Mitotic cells peak at day postoperative 10 and gradually decrease by postoperative day 40. Day 0 is un-operated control. Numbers in parentheses indicate the number of newts for each time point, and bars mark mean±SE.