![]() Figure 4 of
Okamoto, Mol Vis 2007;
13:2112-2118.
Figure 4 of
Okamoto, Mol Vis 2007;
13:2112-2118.
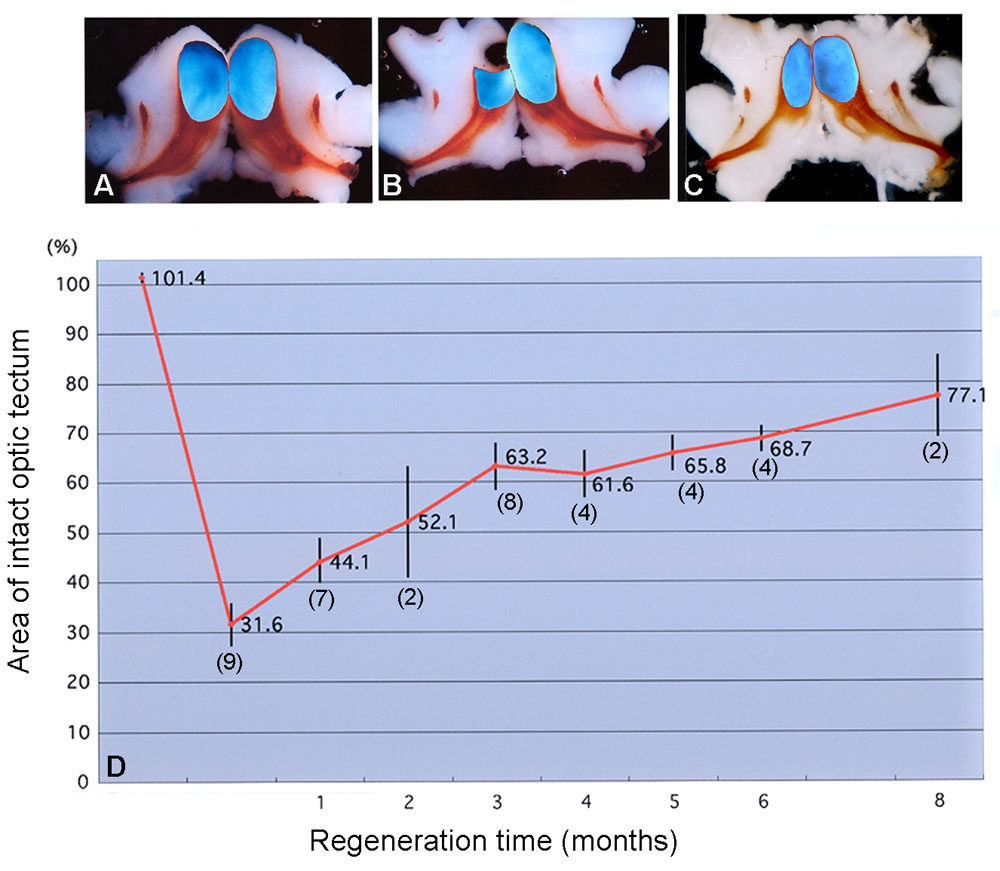
Figure 4. Rate of regeneration of the retinotectal projections during a period of eight months after optic tectum excision
A-C: The blue colored areas indicate the left and right optic tectum in the brain samples processed for quantitation as described in the Methods. A: Unoperated control. B: A sample taken immediately after the excision of the left tectum. Almost 70% of the left OT was excised. C: The OT after eight months. The structure of the original midbrain appeared to have recovered at this stage. D: The recovery rate during eight months. The unoperated right OT, which served as the standard, was compared to the operated left OT, and the recovery rate was observed. The rate gradually increased to about 80% by eight months. Numbers in parentheses indicate the number of newts for each time point, and bars represent mean±SE. The value 101.4% for the un-operated left OT is because we assume as 100% the mean value of the un-operated right OT. Evidently the right OT was slightly smaller.