![]() Figure 4 of
Kottegoda, Mol Vis 2007;
13:2073-2082.
Figure 4 of
Kottegoda, Mol Vis 2007;
13:2073-2082.
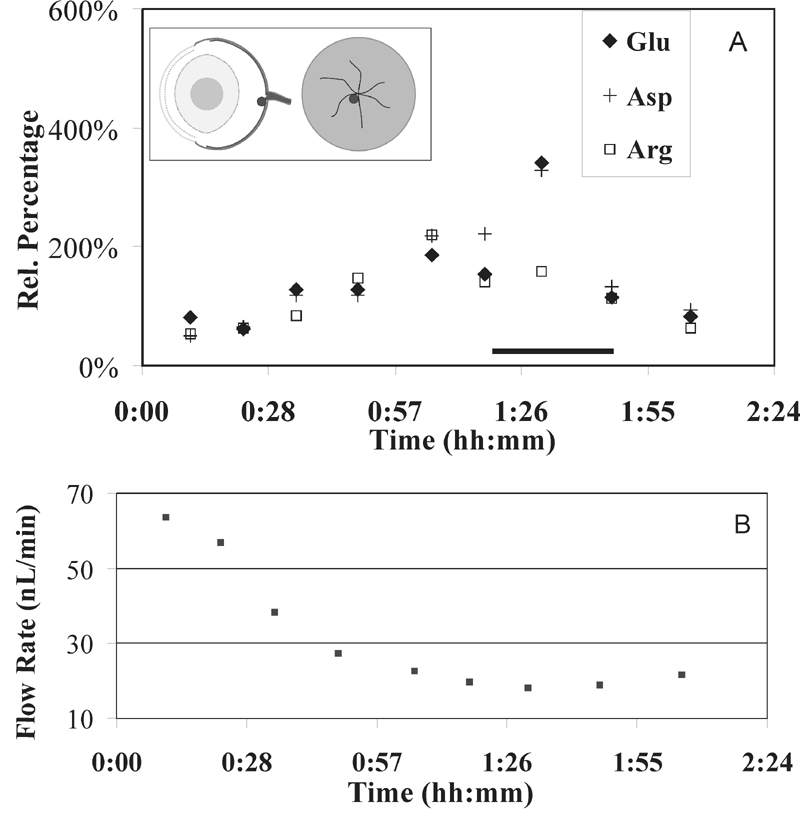
Figure 4. Representative data for confirmation of probe placement
Sampling experiment with L-trans-pyrrolidine-2,4-dicarboxylic acid (PDC) infusion at vitreoretinal interface (VRI) for confirmation of probe placement. Representative data from a single animal is shown. A: Graph showing the relative percentage of amino acid basal levels at VRI. Solid bar indicates PDC infusion at VRI. Inset on the left presents a schematic representation of in vivo collection site marked by the dot. B: The sample collection flow rate (nl/min) determined from the volumes collected and the time required for collection. Basal levels were taken as the average concentration of samples collected from 30-60 min after sample collection initiation. Basal levels increased due to the flow rate decrease during sample collection but the effect of the PDC stimulation was visibly larger for glu and asp.
