![]() Figure 3 of
Kottegoda, Mol Vis 2007;
13:2073-2082.
Figure 3 of
Kottegoda, Mol Vis 2007;
13:2073-2082.
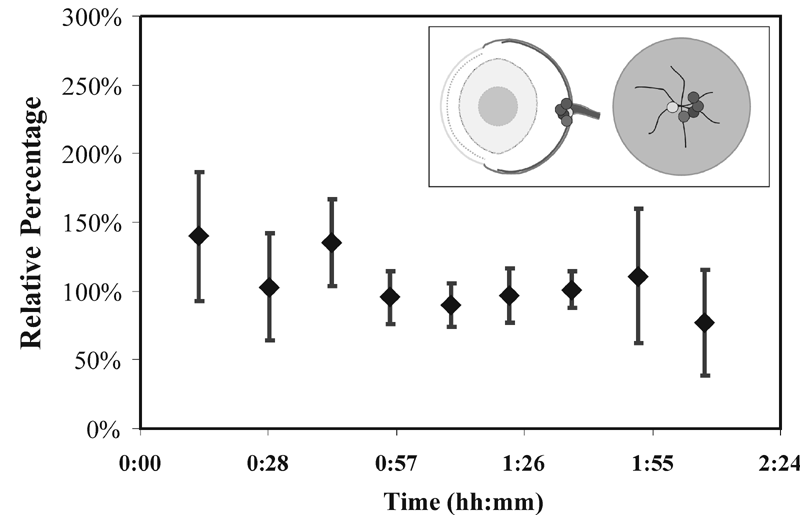
Figure 3. Stability of glutamate basal level during sample collection
Shown is a plot of relative percent of basal glutamate levels taken over the sampling period. The basal value was taken as the average concentration from samples collected during 30-60 min of sampling. Inset shows the schematic of side and front view of the rat eye with the dots representing the sample collection sites. (n=5)
