![]() Figure 3 of
Scholl, Mol Vis 2007;
13:196-205.
Figure 3 of
Scholl, Mol Vis 2007;
13:196-205.
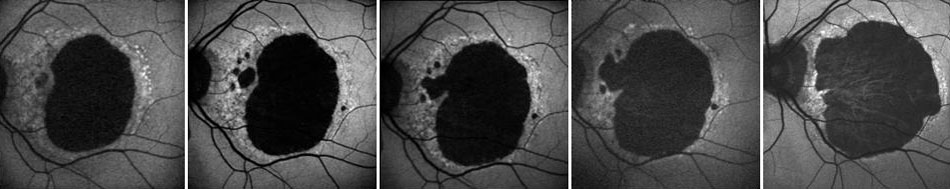
Figure 3. Progression of geographic atrophy imaged by fundus autofluorescence
Fundus autofluorescence images obtained in 12-month intervals in an AMD patient with a cSLO (Heidelberg retina angiograph, HRA classic and HRA 2, Heidelberg Engineering, Dossenheim, Germany). A large kidney-shaped area of GA was present at baseline (left) corresponding to decreased fundus autofluorescence (dark area). Recovered in yearly intervals, the area of the central atrophic area increased [80].