![]() Figure 4 of
Meij, Mol Vis 2007;
13:2012-2018.
Figure 4 of
Meij, Mol Vis 2007;
13:2012-2018.
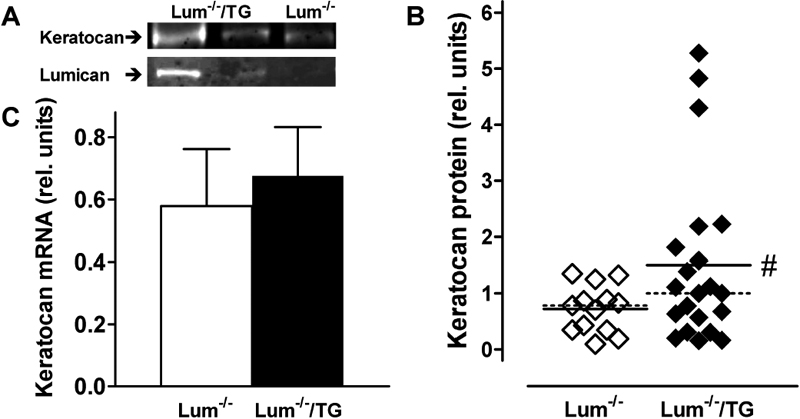
Figure 4. Relative keratocan levels in Lum-/- and Lum-/-/Kera-Lum (Lum-/-/TG) mice
A,B: After SDS-PAGE/western blotting of cornea extracts, immunopositive bands were visualized on a LI-COR Odyssey Infrared Imaging system. A: Examples of keratocan (top row) and lumican (bottom row) protein bands in two Lum-/-/Kera-Lum (left two lanes) and one Lum-/- (right lane) cornea. Note the variation in band intensity between the individual Lum-/-/Kera-Lum samples. B: Keratocan-immunopositive band intensities were determined and normalized against one Lum-/- value. Symbols represent the relative keratocan protein level in each sample (one cornea/mouse), solid lines represent the mean values and the dotted lines represent the medians of 13 Lum-/- and 21 Lum-/-/Kera-Lum mice. C: From the remaining corneas (one/mouse), RNA was extracted and real-time PCR for keratocan was performed with β-actin as the reference gene. Relative keratocan levels were computed as described in Methods as the ratios over the same Lum-/- value. Bars represent mean±SEM of 11 Lum-/- mice and 10 Lum-/-/Kera-Lum mice. The hash mark represents the significance (p<0.05) versus Lum-/- (t-test with Welch's correction).