![]() Figure 2 of
Semple-Rowland, Mol Vis 2007;
13:2001-2011.
Figure 2 of
Semple-Rowland, Mol Vis 2007;
13:2001-2011.
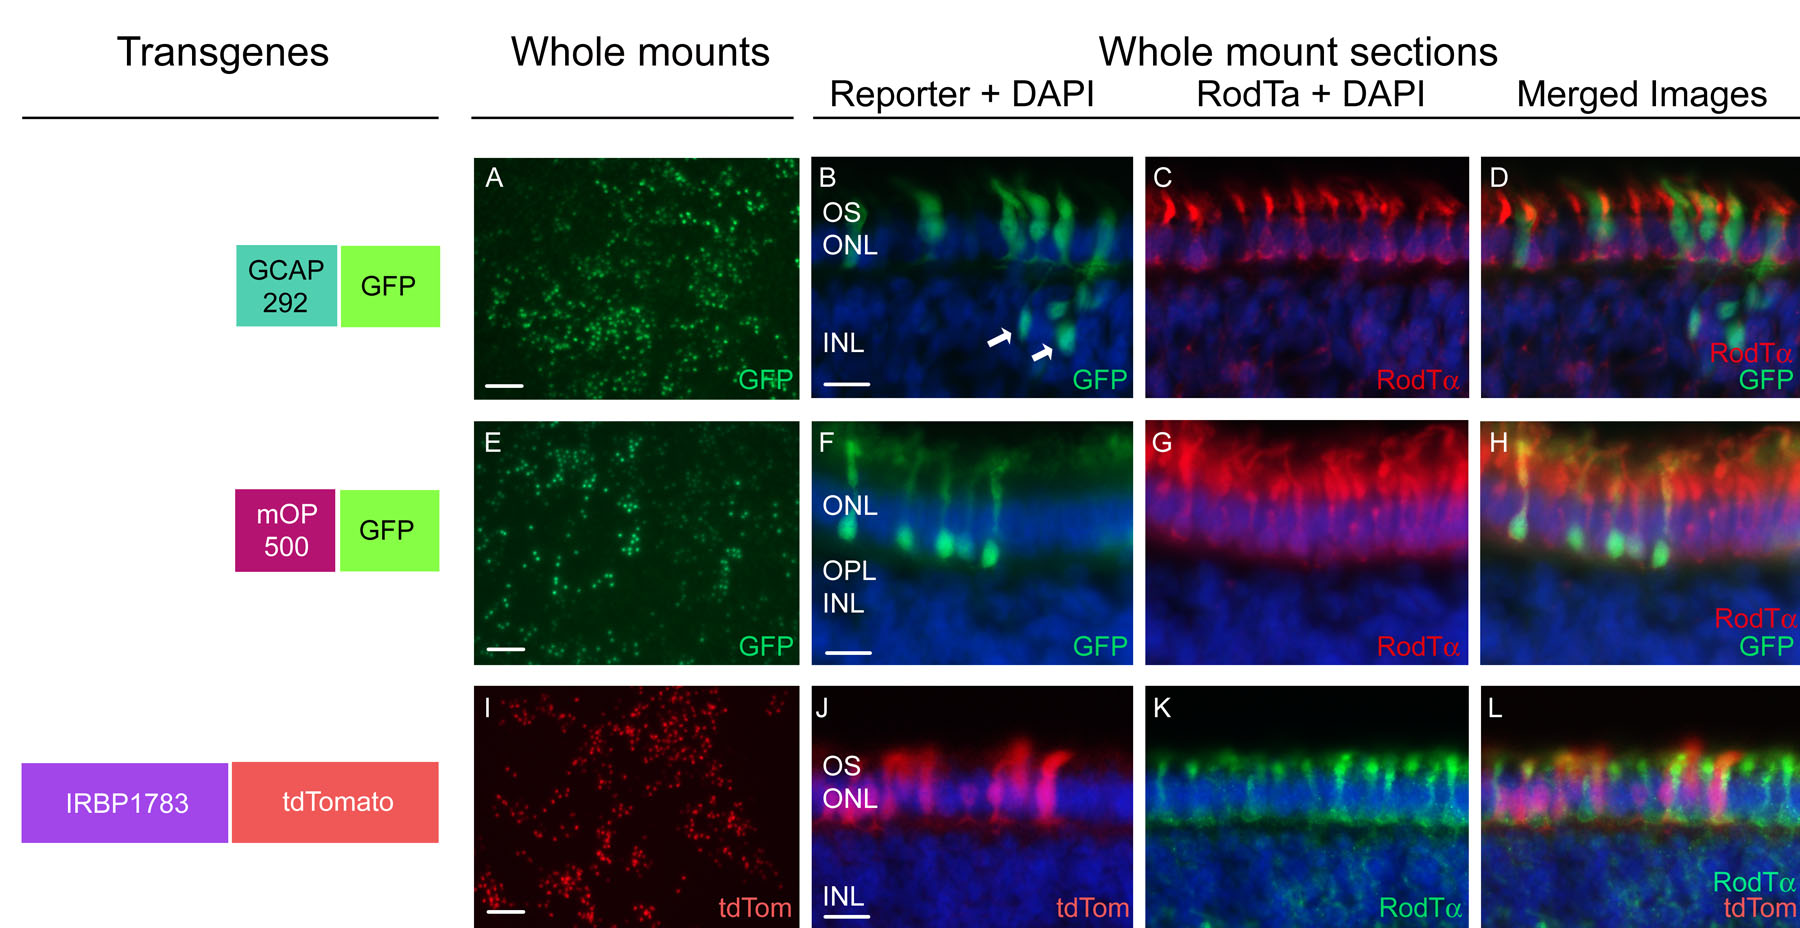
Figure 2. Cellular activities of GCAP292, mOP500 and IRBP1783 promoters in chicken retina
Retinas of embryos treated with pFIN-GCAP292-GFP (A-D), pFIN-mOP500-GFP (E-H), or pFIN-IRBP1783-tdTomato vectors (I-L). A, E, I: Images of whole mounts of retinas treated with the vectors shown in the right panel. All whole mounts were photographed with the photoreceptors positioned nearest the objective. The color coded text in the lower right hand corner of each panel indicates the identities of the sources of the fluorescent signal(s) shown in the section. GFP and tdTom are green and tomato fluorescent proteins, respectively. B, F, J: Fluorescent images of sections of retinas treated with the vectors shown in the right panel counterstained with DAPI. All vectors drove expression of the reporter proteins in cells located in the photoreceptor cell layers. The GCAP292-GFP vector was also expressed in scattered cells in the inner nuclear layer (B, arrows). C, G, K: The sections shown in B, F, and J were immunostained with a rod transducin polyclonal antibody that was visualized using Alexa Fluor 488 (indicated by green text) or Alexa Fluor 594 (indicated by red text) secondary antibodies. D, H, L: Merges of the images shown in B and C, F, and G, and J and K, respectively. Scale bars: All images except those shown in A, E, and I were photographed at the same magnification. The scale bars shown in B, F, and J equal 10 μm. The scale bars shown in A, E, I equal 50 μm. Abbreviations: OS represents outer segments; ONL represents outer nuclear layer; OPL represents outer plexiform layer; INL represents inner nuclear layer.