![]() Figure 2 of
Dentchev, Mol Vis 2007;
13:190-195.
Figure 2 of
Dentchev, Mol Vis 2007;
13:190-195.
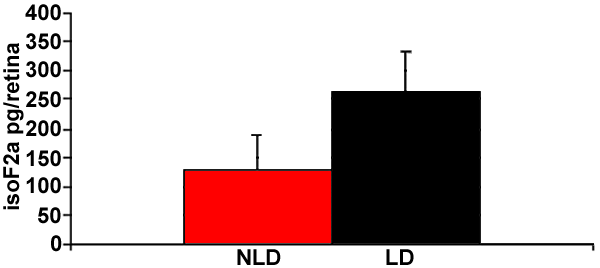
Figure 2. Bar graph showing mean levels of isoprostane F2α-VI in mouse retinal extract
The experimental group (LD, n=8 retinas) had been exposed to bright light. The control group (NLD, n=8) was maintained in normal room light conditions. Bars represent standard deviation. p<0.001, Student's two-tailed t-test.
