![]() Figure 2 of
Bernstein, Mol Vis 2007;
13:1920-1925.
Figure 2 of
Bernstein, Mol Vis 2007;
13:1920-1925.
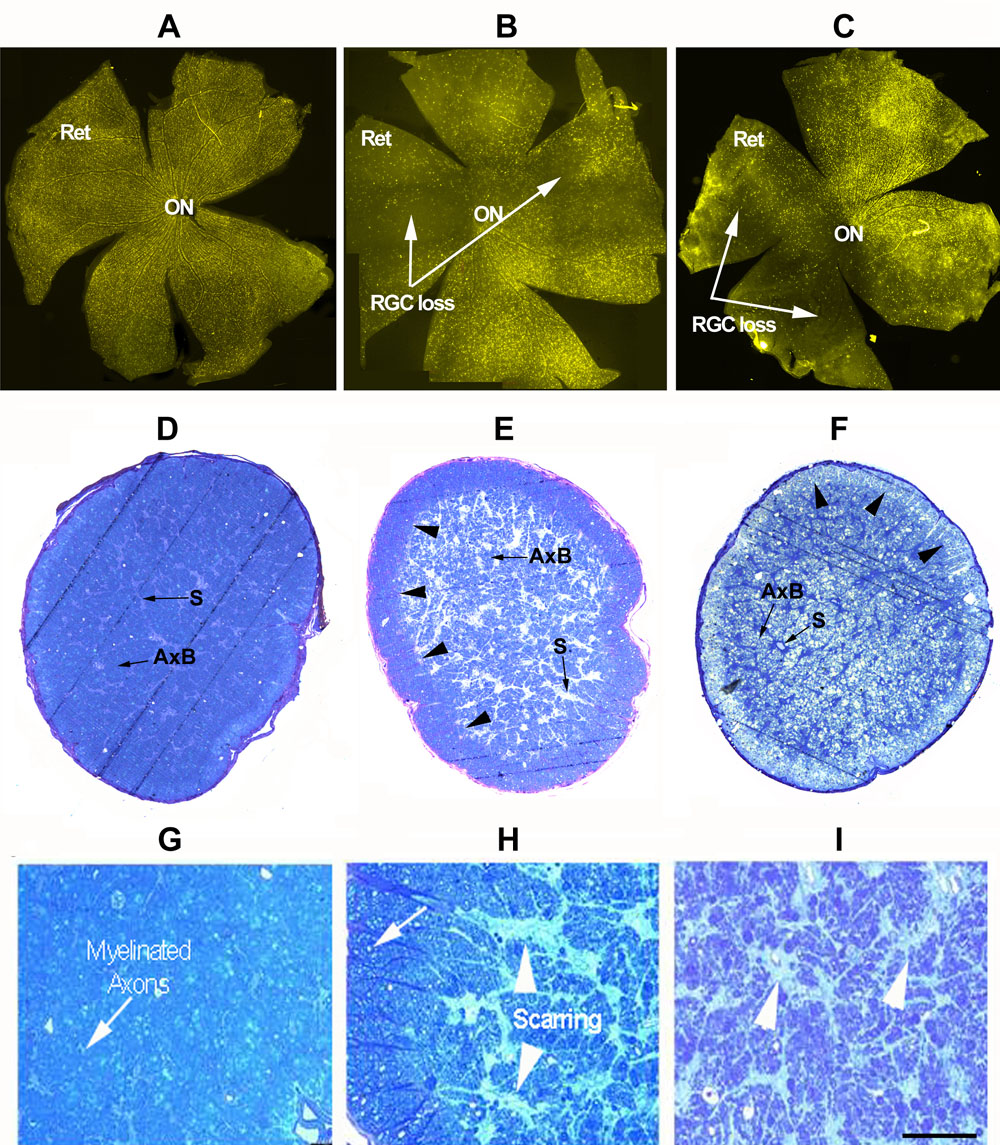
Figure 2. Histological comparison of retinal ganglion cells and optic nerves from naive, estrogen-treated, and vehicle treated animals following rodent anterior ischemic optic neuropathy induction
A, D, G are naíve animals, B, E, H are estrogen-treated animals, and C, F, I are vehicle treated animals. A-C: Distribution of fluorogold labeled retinal ganglion cells (RGC). Retinas from naive controls (A) have fluorogold labeled RGCs distributed over the retinal surface, with increased RGC numbers near the optic nerve (ON). At 28 days after rodent anterior ischemic optic neuropathy (rAION) induction, there is a regional loss of labeled RGCs in the estrogen-treated retina (B, arrows), with preservation of RGC distribution in the inferior wing of the retina. A similar regional RGC loss is seen in the retina of vehicle treated animals (C: arrows). D-F: Low power magnification of toluidine stained ON cross-sections (0.5 μm). D: Naive control. Axonal bundles (AxB) are evenly distributed over the surface, with thin axonal septae (s). E-F: ONs from rAION induced estrogen-treated (E) and vehicle treated (F) animals. There is a marked central loss of axons with increased septal thickness, and shrinkage of the axonal bundles (AxB). The majority of intact axons are present peripherally, with the greatest loss centrally. G-I: High power magnification of toluidine stained ON cross-sections (0.5 μm) from naive control (G), estrogen-treated animal (H), and vehicle-treated control (I) ONs show tightly packed myelinated axons (arrow) with thin septae. ONs from estrogen and vehicle-treated rAION induced animals show axonal loss and ON central scarring, demonstrable as increased septal thickening (arrowheads), with intact peripheral axons (arrow) and reduction in axonal bundle size. The scale bar represents 50 μm.