![]() Figure 1 of
Kamphuis, Mol Vis 2007;
13:1892-1901.
Figure 1 of
Kamphuis, Mol Vis 2007;
13:1892-1901.
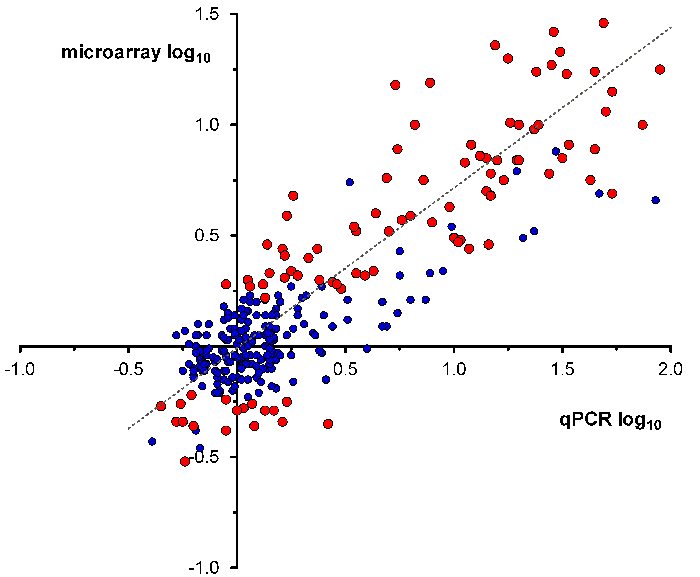
Figure 1. Linear regression between qualitative polymerase chain reaction and microarray data
Linear regression between quantitative polymerase chain reaction (qPCR) and microarray data, both expressed as log10 fold-change for different experimental groups with reference to the levels in controls. Each of the 291 data points (blue and red dots combined) is the average of 4 to 7 animals; (R2=0.75; y=0.66x-0.03). The trend line shown is based on a subset of 95 data points meeting the microarray selection criteria; (R2=0.73; y=0.72x-0.01). The data for qPCR validation included reference genes (Gapdh, Hprt, Grm6, Prkca), genes known to give an early response to ischemia (fos, jun), genes known to show a more delayed response (Ccn1, Cldn5, Gfap, Gria1, Gria2, Hmox1, Hspb6, Icam1, Nes, Pax6, Spin2, Stx1a, Pvalb, Vegfa, Vim, Vip, Thy1), no response (Crym, Cryz, Nos2), and genes that were identified with a differential response (A2m, Anxa1, C3, Cars, Egr1, Iars, Il1b, Il6, Lars, Muc4, Nars, S100a8, Slc7a1, Tars, Yars).
