![]() Figure 4 of
Pan, Mol Vis 2007;
13:181-189.
Figure 4 of
Pan, Mol Vis 2007;
13:181-189.
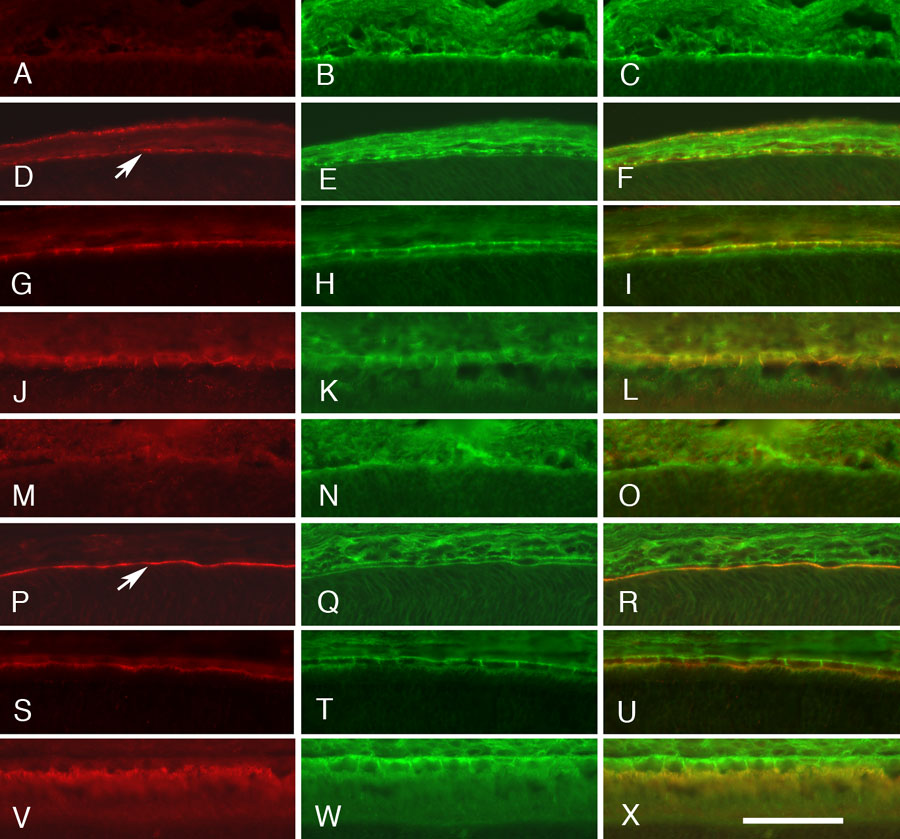
Figure 4. Colocalization of CD81 with Sap97 and EBP50 in the developing retinal pigment epithelium layer
The developmental pattern of expression of Sap97 (A, D, G, J), EBP50 (M, P, S, V), and CD81 (B, E, H, K, N, Q, T, W) is shown for the retinal pigment epithelium (RPE) cell layer in double-stained sections at different developmental ages: P0 (A-C, M-O), P2 (D-F, P-R), P10 (G-I, S-U), and P15 (J-L, V-X). The merged images are shown to the right (C, F, I, L, O, R, U, X). At P0 (A-C, M-O) CD81 levels are low, with only a faint outline of the developing RPE. There is little immunostaining for Sap97 (A) or EBP50 (M). By P2 (D-F, P-R), CD81 defined the cellular membranes of the RPE cells. There is a clear upregulation of Sap97 along the basal surface of the RPE (D, arrow). Sap97 is distributed on the basolateral surfaces of the RPE cells (F). The levels of EBP50 are also increasing (P), forming a tight band of immunoreactivity at the junction between the RPE cells and the developing photoreceptors (arrow). EBP50 immunoreactivity labels the apical surface of RPE cells (R). The levels of all three proteins increase over time, and the immunolabeling pattern becomes more distinct at P10 and P15. All photomicrographs were taken at the same magnification. In the scale bar, X=25 μm.