![]() Figure 2 of
Giordano, Mol Vis 2007;
13:1842-1850.
Figure 2 of
Giordano, Mol Vis 2007;
13:1842-1850.
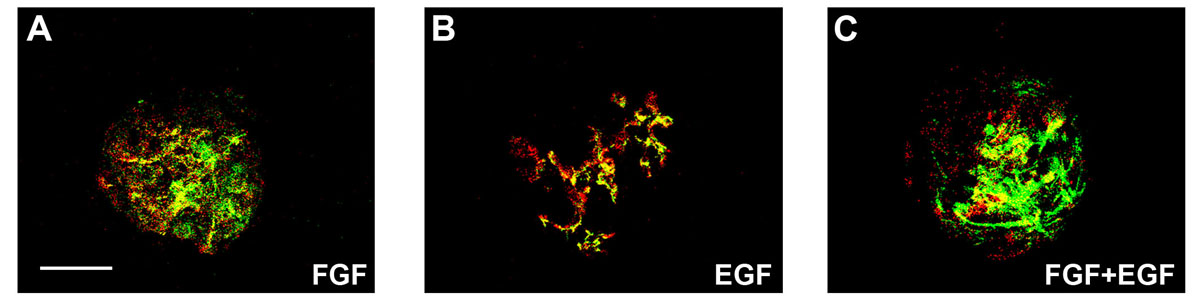
Figure 2. Expression of progenitor markers, FGFR1 and EGFR, in retinal spheres
A-C: Spheres grown with either fibroblast growth factor (FGF; A) or epidermal growth factor (EGF; B) or FGF+EGF (C) were stained with antibodies anti-nestin (green) or anti-Pkcα (red). Some cells co-expressed nestin and Pkcα (yellow). Scale bar represents 60 μm. D-F: In these panels, the percentage of nestin (D), Pkc-α (E), and GFAP (F) positive cells are given after treatment with either FGF (red bar), EGF (yellow bar) or FGF+EGF (green bar). Values are shown as percentage of stained cells versus the total number of nuclei and are the average of positive cells counted in five spheres of three different experiments. G: Percentage of cells in proliferation bromodeoxyuridine (BrdU+) that were labeled with anti-Pkc-α (Pkcα+) in spheres grown with either FGF (red bar), EGF (yellow bar), or FGF+EGF (blue bar). More than 50% of cells in proliferation expressed Pkc-α. H-I: Quantitative analysis of FGFR1 mRNA (H) and EGFR mRNA (I) expression in spheres cultured for seven days in the absence of any growth factor (GF; blue bar) or in the presence of either FGF (red bar), EGF (yellow bar) or FGF+EGF (blue bar). Expression of both receptors was increased by treatment with GFs. FGFR1 receptor was similarly expressed when spheres were grown with FGF alone and FGF+EGF. Differently EGFR expression showed an additive effect when spheres were cultured with FGF+EGF. The Student t-test was employed, and significance was calculated by comparing spheres grown with FGF to spheres grown with either EGF or FGF+EGF. Asterisk (*) represents p<0.05, double asterisk (**) indicates p<0.01, and triple asterisk (***) indicates p<0.001.