![]() Figure 2 of
Lupien, Mol Vis 2007;
13:1828-1841.
Figure 2 of
Lupien, Mol Vis 2007;
13:1828-1841.
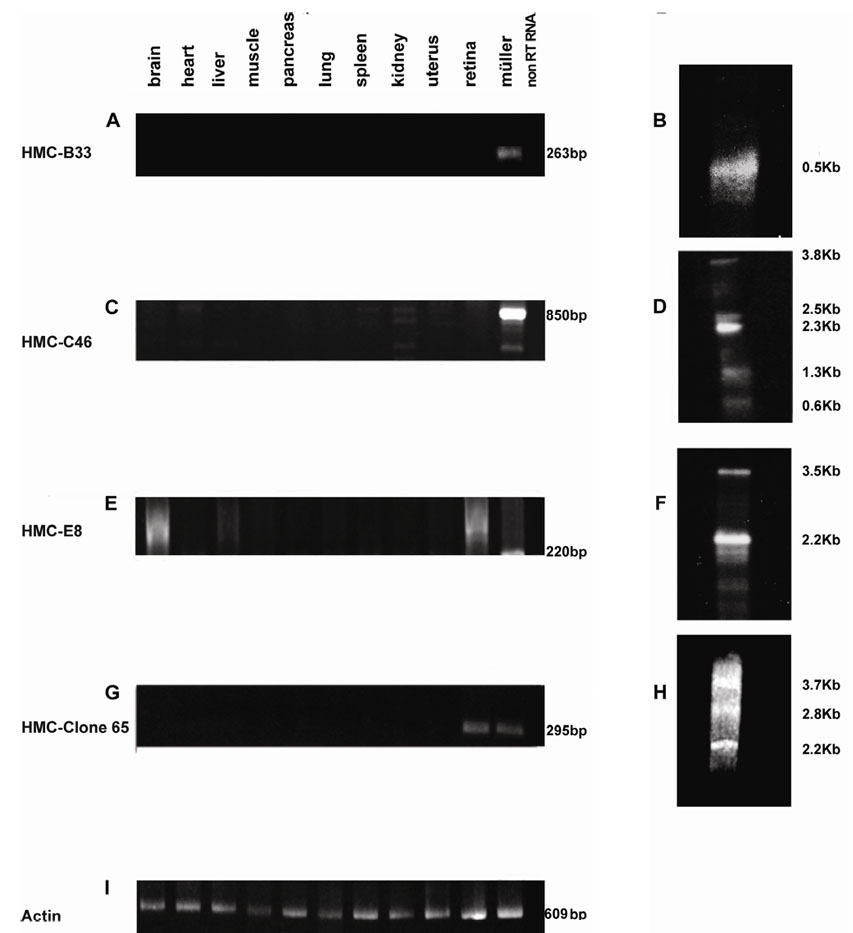
Figure 2. Novel Müller cells cDNAs
HMC-B33 (A, B), HMC-C46 (C, D), HMC-E8 (E, F), HMC-Clone 65 (G, H), normalization with actin (I), RT-PCR analyses (A, C, E, G, and I) with 10 different cDNAs tissues (brain, heart, liver, muscle, pancreas, lung, spleen, kidney, uterus, retina, and Müller) as well as a non retro transcribed Müller cells RNA (non RT RNA; used as negative control). Northern blot analyses (B, D, F, and H) with retinal mRNA. The length of each transcript is indicated in the figure.