![]() Figure 4 of
Dekomien, Mol Vis 2007;
13:174-180.
Figure 4 of
Dekomien, Mol Vis 2007;
13:174-180.
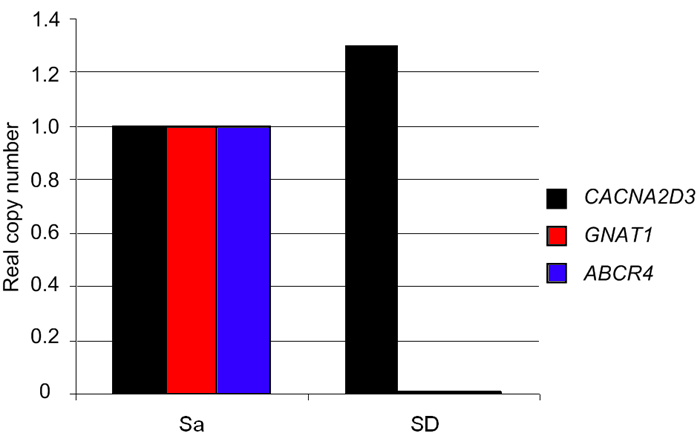
Figure 4. Analysis of gene expression by quantitative real-time reverse transcriptase polymerase chain reaction
Real-time RT-PCR was used to determine the expression of the genes CACNA2D3, GNAT1, and ABCA4 by calculating the real copy number. Expression levels were normalized to those of the HPRT1 gene. No differences were obvious between the unaffected Saarloos/Wolfshound (Sa; N=2) and the g-PRA affected Schapendoes (SD; N=1) for CACNA2D3 mRNA. GNAT1 and ABCA4 mRNA expression is substantially reduced or absent in retinal tissue of the affected Schapendoes.
