![]() Figure 4 of
Jiang, Mol Vis 2007;
13:1783-1792.
Figure 4 of
Jiang, Mol Vis 2007;
13:1783-1792.
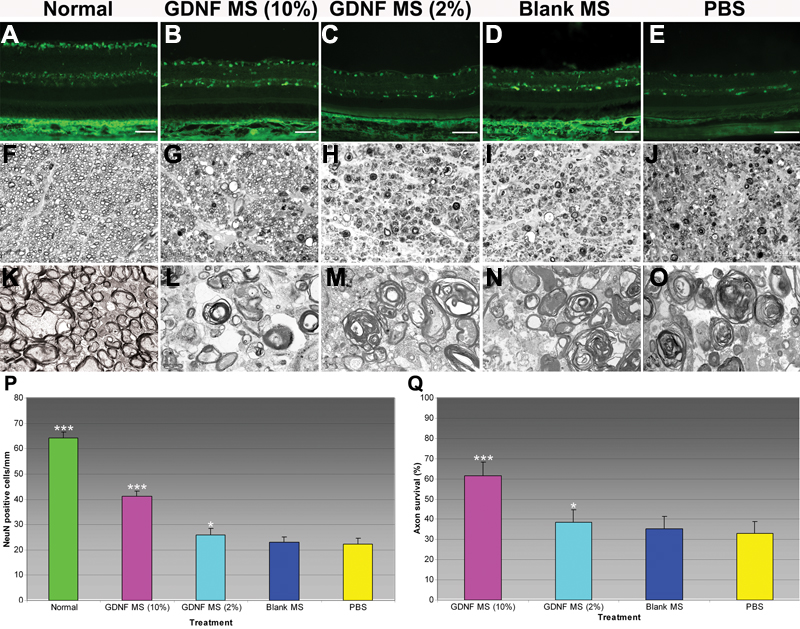
Figure 4. GDNF microspheres increased retinal ganglion cells and their axons survival
A-E Effects of GDNF microsphere (MS) treatment on the survival of RGCs (anti-NeuN positive cells) due to chronic IOP elevation (scale bars represent 100 μm): A shows a normal retina without IOP elevation. Ten percent of GDNF MS treatment (B) resulted in the preservation of RGCs, and 2% GDNF MS treatment (C) resulted in moderate preservation of RGCs compared with blank MS (D) and PBS treatment (E). F-O Effects of GDNF MS treatment on axon survival due to chronic IOP elevation: F illustrates normal ON axons without IOP elevation. Ten percent of GDNF MS treatment (G) resulted in a preservation of axons, and 2% GDNF MS treatment (H) resulted in a moderate preservation of axons compared with blank MS (I) and PBS treatment (J). Degenerating axons occupied nearly the entire mass of the ON of rats treated with blank MS (I) and PBS (J). K-O are corresponding representative EM photos. F-J: magnification 1000X; K-O: magnification 7100X. P shows the quantitative analysis of GDNF MS treatment on the survival of RGCs. Chronic IOP elevation resulted in a significant loss of the RGCs (p<0.001). Ten percent of GDNF MS treatment significantly increased the RGC survival compared with 2% GDNF MS treatment, blank MS treatment, and PBS treatment (p<0.001). Two percent of GDNF MS treatment resulted in significant reservation of RGCs compared with PBS treatment (p<0.05). There were no significant differences between groups treated with 2% GDNF MS versus blank MS and between groups treated with blank MS versus PBS (p>0.05). Q illustrates the quantitative analysis of GDNF MS treatment on the ON axon survival. The survival percentage was 61.58% with 10% GDNF MS treatment compared with 38.56% with 2% GDNF MS treatment, 35.25% with blank MS, and 33.12% with PBS treatment (p<0.001). Two percent of GDNF MS treatment increased the survival percentage compared with PBS treatment (p<0.05). There were no significant differences between groups treated with 2% GDNF MS versus blank MS and between groups treated with blank MS versus PBS (p>0.05). Three asterisks indicate p<0.001 and one asterisk denotes p<0.05. In the figure, MS represents microsphere.