![]() Figure 1 of
Yao, Mol Vis 2007;
13:1769-1776.
Figure 1 of
Yao, Mol Vis 2007;
13:1769-1776.
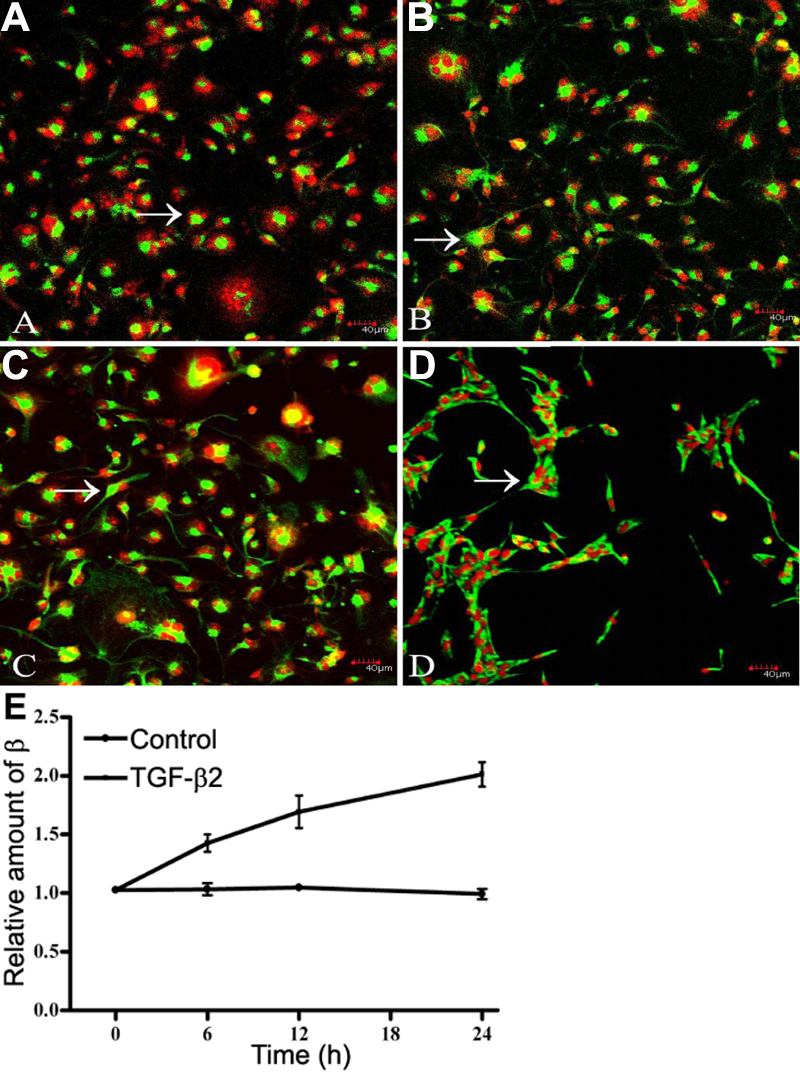
Figure 1. Increased expression of integrin β1 in cultured human lens epithelial cells during TGF-β2 treatment
A shows the control while B to D show HLECs treated with TGF-β2 for 6 h, 12 h, and 24 h, respectively. Immunofluorescent staining for integrin β1 (green) and propidium iodide nuclear counter-staining (red). E: Quantification of relative amounts of fluorescence for β1 subunit analyzed by flow cytometry is shown. Each point represents the mean±S.E. of data at each time point from three separate experiments.