![]() Figure 8 of
Valamanesh, Mol Vis 2007;
13:1746-1757.
Figure 8 of
Valamanesh, Mol Vis 2007;
13:1746-1757.
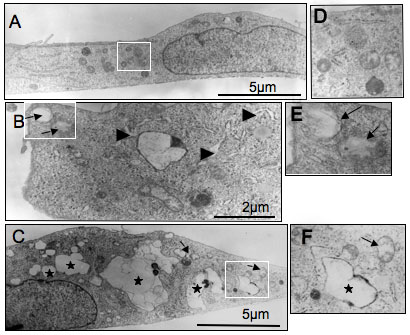
Figure 8. Transmission electron microscopyobservations of TA-treated ARPE 19 cells
A: Control ARPE 19 cells. B and C: ARPE-19 cells TA-treated with 0.1 mg/ml (B) and 1 mg/ml TA (C), showing membrane limited (arrows) or unlimited vesicles (stars) and dilated endoplasmic reticulum (arrowhead). In picture C, a more advanced stage of degeneration is represented.