![]() Figure 3 of
Roman, Mol Vis 2007;
13:1701-1710.
Figure 3 of
Roman, Mol Vis 2007;
13:1701-1710.
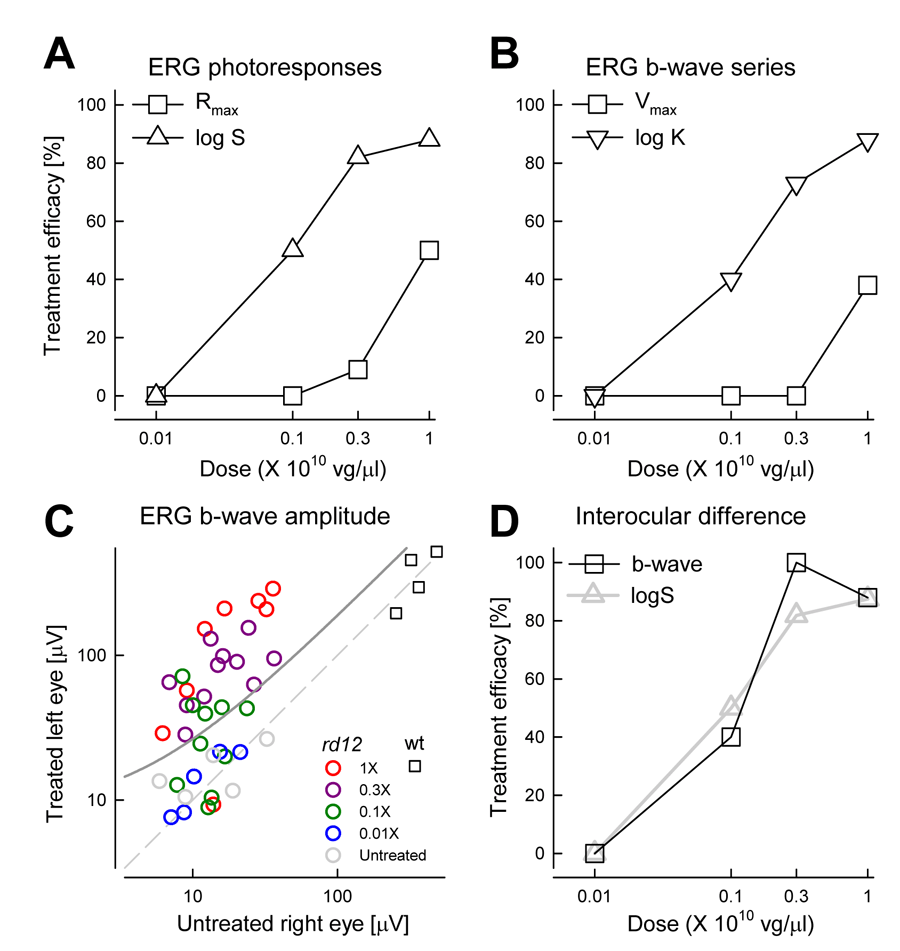
Figure 3. Treatment efficacy as a function of vector dose
A: Sensitivity (log S) parameter of ERG photoresponses detects efficacy at lower doses than the maximum amplitude (Rmax) parameter. B: Sensitivity (log K) parameter of b-wave luminance-response function detects efficacy at lower doses than the maximum amplitude (Vmax) parameter. Both sensitivity parameters predict 50% efficacy near 0.1X dose whereas maximum amplitude parameters predict 50% efficacy near 1X. C: Comparison of ERG b-wave amplitude evoked by a 0.1 log scot-cd.s.m-2 flash in treated (left) eyes versus untreated (right) eyes. Dashed line represents no inter-ocular difference in this parameter. Upper limit of significant inter-ocular difference derived from untreated rd12 and wt animals is shown with solid line. D: Treatment efficacy estimated using the interocular difference (IOD) of b-wave amplitude is similar to the IOD analysis of photoresponse sensitivity (log S) predicting 50% efficacy near 0.1X dose.
